
Executive Summary
A lender benchmarking a small business portfolio against published commercial and industrial delinquency is measuring it against a population its borrowers are not in. Roughly four fifths of the balances behind that rate are loans over $1 million, and the error runs in the direction that understates risk. That gap holds whether the book is conventional or guaranteed, because it sits in the reporting framework rather than in any lending program.
That matters now because small business and large corporate credit are widely described as diverging, a split often called K-shaped: an upper leg of borrowers who absorbed the rate cycle intact, and a lower leg of borrowers who did not. Public data cannot confirm it or rule it out. Bank regulators collect loan size when counting volume but not when reporting performance, so no small business delinquency rate exists anywhere in the public record. The series that are published separate banks by their own size rather than by the size of their borrowers, and any verdict drawn from them changes with the starting point and the measure chosen.
Loan-level data answers what the aggregates cannot, and the SBA 7(a) record is where that data exists in usable depth. It is used here not to study a federal program but because it carries thirty years of performance with term, sector, lender, and outcome attached to each loan, which is the linkage the Call Report omits. Across more than two million 7(a) loans, defaults are up against the last expansion in every size and term bucket, while the prepayment exit has narrowed for borrowers on short amortization and held for those on long. Portfolio-wide, defaults rising while prepayment falls has occurred once before in a record that begins in 1996, from 2007 through 2010. Borrowers on short paper who would historically have sold, refinanced, or otherwise exited without a loss are staying on the books until they fail.
Two operational questions follow, and no aggregate answers either. What is already in the book, and what is being added to it. Portfolio Insights scores an existing portfolio loan by loan, conventional or SBA, for probability of default, loss given default, and expected loss, benchmarked against a loan-level small business population rather than a C&I average. Prime+ does the same at the point of origination through an API. Both draw on the performance history behind every finding in this analysis.
Key Takeaways
Public C&I data cannot resolve small business performance. Schedule RC-C Part II collects loan size for volume; Schedule RC-N does not collect it for performance. No small business delinquency rate exists anywhere in the public record, and most of the balances behind the published rate are loans over $1 million.
The published series demonstrably do not track small business conditions. Delinquency at banks outside the hundred largest fell sharply in the quarter the economy shut down in 2020 while the series for the hundred largest rose. Relief lending entering the denominator explains it, and it is the only downturn in the series' history where the measure fell. Those series split banks by their own size, and small banks proxy for small business no better than large banks do.
No verdict on divergence survives the choice of base date or measure. Four defensible starting points produce four answers, two reversing the sign. Delinquency and charge-offs sit on opposite sides of their last-expansion range.
Loan-level performance shows defaults rising while the exit narrows, and term structure sorts both. Defaults are above their last-expansion level in every size and term bucket and in eighteen of nineteen sectors. Prepayment is below its expansion level in the short-term buckets and in fifteen of nineteen sectors, and roughly flat on long-term paper. The combination has one prior occurrence in a record beginning in 1996, during the financial crisis.
The narrowing exit is not rate lock-in. 7(a) credit carries quarterly-adjusting variable rates, so borrowers hold no below-market loan worth protecting. Prepayment peaked during the tightening cycle and has fallen every year since, including 2025, when the average prime rate declined and defaults rose.
Term structure lowers the payment and raises the sensitivity. Long-term loans default at roughly a quarter of the portfolio rate, with no exceptions across the sixteen sectors large enough to measure, because the borrower carries far less debt service. The same length makes them more rate-sensitive, so their advantage compressed as prime rose: 0.54 points of deterioration against the portfolio's 1.44.
The same direction shows up on conventional paper. Across 88,917 applications at five non-SBA lenders, predicted default at origination roughly tripled between the 2019 to 2021 and 2024 to 2025 vintages. Those are predicted defaults at origination, not realized outcomes on a seasoned book, since no one publishes seasoned conventional small business performance. The direction is the same, and no program explains it.
A book benchmarked against C&I aggregates is measured against the wrong population. Across 199 lenders the median default rate rose by more than half against its pre-pandemic level, and the distribution widened almost entirely from the worst-performing end. Portfolio size did not order the outcome, so this is not a small-lender problem.
Figures supporting each of these appear in the sections below, current as of August 2026.
The Call Report Blind Spot: Volume Without Performance
The gap starts with two schedules that were never designed to be read together.
Call Report Schedule RC-C Part II collects loans to small businesses by original amount, in buckets of $100,000 or less, $100,000 to $250,000, and $250,000 to $1 million, reporting both the number of loans and the amount outstanding. The schedule was introduced under Section 122 of the Federal Deposit Insurance Corporation Improvement Act of 1991 and took effect on June 30, 1993. It was collected annually each June until 2010, and more frequently since, quarterly or semiannually depending on the filer.
Schedule RC-N, which reports loans past due and on nonaccrual, is not stratified by loan size at all. Delinquency arrives at the aggregate commercial and industrial level and nowhere below it.
So a small business delinquency rate cannot be computed from the Call Report. The volume split exists and the performance split does not, and because the framework never collected performance at loan level, no adjustment to the published aggregates can recover a true borrower-size split.
This is visible without leaving a single file. The Federal Deposit Insurance Corporation publishes its Quarterly Banking Profile time series as one workbook. The tab headed Small Business-Farm Loans carries the RC-C Part II buckets. The tab headed Loan Performance carries past due, nonaccrual, and net charge-off rates, stratified by collateral type and by whether the borrower is a US addressee, and not by a single dollar threshold anywhere in it. One agency, one workbook, and nothing to join the two halves.
The same source sizes the problem. Loans under $1 million were 20.0% of domestic C&I balances at June 2025, against 19.2% at June 2019 and roughly a third in the mid-1990s. Small business lending is about a fifth of the book and has been stable at about that level for a decade. The published delinquency rate is therefore a weighted average in which small business credit carries roughly one vote in five, and the framework offers no method to recover that vote.
Part of that long decline is not a decline at all. The $1 million threshold has never been indexed, so it has been defining "small" in 1992 dollars for thirty-four years, and a borrower who fit inside the bucket in 1995 may sit outside it now on the same real credit need. Some of the fall from a third to a fifth is therefore measurement rather than lending behavior. But it cannot be all of it: the share was higher in 2004 than in 1995 despite steadily climbing prices, and rose again from 17.8% to 20.0% between 2022 and 2025, through the highest inflation in four decades. A frozen threshold erodes in one direction only. This series does not. What the data cannot say is how much of the 2005 to 2019 decline was threshold erosion, how much was large corporate lending growth, and how much was a genuine retreat from the segment.
One implication runs against the framing above and should be stated rather than left for a reader to find. If the threshold understates what counts as a small business loan today, the aggregate contains more small business credit than a fifth. The claim that most of the balance is loans over $1 million holds, because that is a statement about loan size. The implication, that the remainder is therefore large corporate borrowing, holds more loosely than the number suggests.
Why the gap exists
The gap is not an oversight. Section 122 also suggested collecting charge-off data, and the FFIEC declined, concluding that loss figures would not add enough to an assessment of credit availability to justify the cost of reporting them. The schedule was built to answer whether small businesses could get credit, and it answers that.
The limits are on the record. In 2018 the Government Accountability Office found that because the data capture loans by size rather than by the size of the borrower, they do not accurately reflect small business lending, and that this hampers regulators and policymakers trying to assess it. The agencies sought comment the following year on raising the thresholds, indexing them to inflation, or identifying borrowers by revenue. The bands are still the original loan amounts set in 1992.
None of which makes the instrument defective. It measures access, which is what it was asked to measure, and was never asked to measure performance.
The Federal Reserve Board's delinquency series inherit the limit and add one of their own. They separate banks ranked among the hundred largest from all others, which is a split by lender size rather than by borrower size. A community bank's business loan line is dollar weighted toward its own largest borrowers in the same way a money center bank's is, and both lend to firms that refinanced in 2020 and to firms that did not.
Loan size is simply what the framework collects. In the loan-level record below, average term has a strong relationship with sector default rates that survives controlling for loan size, while loan size has none once term is controlled for. What separates borrowers is the structure of their debt and their access to alternatives, and the Call Report records neither: no term, no rate type, no sector, no borrower. The gap is therefore wider than a missing cut. The framework carries no dimension along which these outcomes divide.
The Stress Test: What PPP Revealed About the Public Series
Claiming that data cannot see what it fails to show is easy, and usually wrong. Such a claim holds only if it survives a test where the answer is known in advance.
The Paycheck Protection Program is that test. It was a small business program of enormous scale, delivered disproportionately through smaller institutions, and its loans were fully guaranteed and performing by design.
In the first quarter of 2020, delinquency at banks outside the hundred largest read 1.89%. In the second quarter, the quarter the economy shut down, it read 1.13%, a fall of 40%. Over the same quarter the series for the hundred largest banks rose 25%, from 1.05% to 1.31%. The two moved in opposite directions, and the one that fell is the one weighted toward small business lenders. Small bank business credit quality did not improve by two fifths in the spring of 2020. A very large volume of new, guaranteed, performing loans entered the denominator and the ratio fell.
The history settles the reading. This measure rose in every prior downturn, reaching 6.67% in the 1990 to 1991 downturn, 3.19% in 2001, and 3.76% in 2009. The 2020 episode is the only downturn in a thirty-nine year record where it fell.
RC-C Part II shows the same distortion independently, in a dataset with no connection to the delinquency series. Balances under $1 million ran about $368 billion at June 2019, about $625 billion at June 2020, and about $387 billion by June 2022. Roughly a quarter of a trillion dollars entered the small business buckets and left again, and the reported small business share of C&I rose to 26.5% before falling back. Neither series was measuring small business conditions across those years. Both were measuring a relief program passing through.
The Baseline Trap: Why the Same Data Supports Opposite Conclusions
The series readings in this section and the two that follow are current as of August 2026 and are refreshed periodically. The arguments they support do not depend on the specific values.
Two consequences follow, and both cut against reaching a verdict from public data.
The first is that any comparison anchored on the 2021 low is largely measuring that relief program running off. Delinquency at banks outside the hundred largest is up more than 90% from its first quarter 2021 reading while the series for the hundred largest is up 2%. That is a real and useful measure of how far conditions have moved since the trough, and it is the wrong instrument for this particular question, because the question here is whether two groups diverged rather than how much recovery has occurred. Its opposite is wrong for the same reason, and that is what the next table shows.
The problem is general. Measured to the first quarter of 2026, the same two series give:
Starting point | Banks outside the 100 largest | 100 largest banks | Apparent reading |
|---|---|---|---|
Q4 2019, pre-pandemic | +22% | +21% | No divergence |
Q1 2020 | −7% | +19% | Divergence, reversed |
Q1 2021, the low | +93% | +2% | Strong divergence |
Q1 2022, before the hiking cycle | +16% | +28% | Divergence, reversed |
Four defensible starting points produce four answers, two of them pointing the opposite way from the other two. The starting point that best fits a rate-transmission argument, the quarter before prime began moving, is the one that flatters it least.
The second consequence is that the answer also depends on which measure is chosen. Anchored on the 2015 to 2019 expansion, which contains no recession and ends before the relief program, delinquency and charge-offs disagree:
Federal Reserve series | 2015-19 average | 2015-19 range | Q1 2026 | Position |
|---|---|---|---|---|
C&I delinquency, all commercial banks | 1.18% | 0.75 to 1.60 | 1.34% | Inside range |
C&I delinquency, 100 largest banks | 1.10% | 0.61 to 1.54 | 1.25% | Inside range |
C&I delinquency, banks outside the 100 largest | 1.71% | 1.44 to 2.03 | 1.76% | Inside range |
C&I net charge-offs, all commercial banks | 0.33% | 0.17 to 0.45 | 0.59% | Above range |
C&I net charge-offs, 100 largest banks | 0.32% | 0.16 to 0.44 | 0.59% | Above range |
C&I net charge-offs, banks outside the 100 largest | 0.41% | 0.23 to 0.58 | 0.61% | Above range |
On delinquency, bank business credit is where it was before the pandemic. On realized losses it is above where it was, at every bank size, and the proportional rise is larger at the hundred largest banks than at the rest. The two behave differently by construction. A delinquent loan sits in the numerator while it stays on the balance sheet, but once it is charged off the balance leaves the numerator and the denominator together, registering once and then disappearing. Neither measure shows one group pulling away from the other.
The aggregates cannot resolve the question. They do not disprove a divergence and cannot establish one, because the split they offer is not the split the question turns on. Sorting banks by their own size does not sort borrowers into an upper and a lower leg, and no other cut in the public record does either. Anyone claiming a K from these series has chosen a base and a measure, and the choice is doing the work.
This discipline is not peculiar to small business credit. In August 2026, economists at the Federal Reserve Bank of New York examined why two published measures of credit card delinquency had been telling opposite stories since 2023. The measure counting the accumulation of delinquent balances had climbed toward levels last seen after the financial crisis, while the measure counting new delinquencies each quarter had been flat for close to two years. The reconciliation was that charged-off debts were being reported to the credit bureaus for longer than they used to be, so they accumulated without any change in the rate at which borrowers were falling behind. Roughly two fifths of charged-off debts were still being reported a year later in the years to 2012, against roughly four fifths by 2024. Those balances were dead accounts still sitting in the count, and once they are taken out, the alarming measure and the calm ones describe the same thing.
Neither measure was wrong. They were answering different questions, and settling which question mattered required the loan-level panel beneath the aggregates rather than the aggregates themselves. That is the same move this analysis makes, on a different asset class, and it points to the same place: the loan-level record underneath.
Loan-Level Reality: Rising Defaults, Closing Exits on Short Paper
Everything above can be checked by a reader with a browser. What follows cannot, because it requires performance history on individual loans rather than on balances.
A loan that leaves a portfolio before maturity does so in one of two ways: voluntary prepayment through refinancing, a business sale, or cash flow, or default. The two compete for the same loans, so they tend to move together: conditions that push defaults up also close off the refinancings and business sales that produce prepayments, and improving conditions do the reverse. Divergence between them is rare, and it carries one meaning: borrowers who would once have sold the business, refinanced, or paid the loan off are staying on the books until they fail.
Across the 7(a) portfolio split into four buckets by loan size and original term, defaults rose and prepayments fell between 2019 and 2025 in all four:
Bucket | Default 2019 | Default 2025 | Ratio | Prepayment 2019 | Prepayment 2025 |
|---|---|---|---|---|---|
Under $1M, under 15 years | 2.91% | 3.99% | 1.37 | 11.07% | 8.60% |
Under $1M, 15 years and over | 1.35% | 2.18% | 1.61 | 10.62% | 9.50% |
Over $1M, under 15 years | 3.24% | 4.14% | 1.28 | 9.72% | 9.05% |
Over $1M, 15 years and over | 1.62% | 2.58% | 1.59 | 13.02% | 9.91% |
Taken portfolio-wide across the seven original-term buckets in our performance data, the years in which the default rate rose while the prepayment rate fell are 2007 through 2010 and 2023 through 2025, with the first quarter of 2026 continuing the pattern. Prepayment behavior itself, including how conditional prepayment rates are constructed and why the second exit matters, is treated in our analysis of SBA 7(a) prepayment speeds. Two episodes in a record that begins in 1996, and the prior one is the financial crisis. The resemblance is in the pattern, not the cause. The composition of sector losses now looks nothing like 2009, and we make no claim that the two periods share a mechanism. What they share is that borrowers stopped being able to leave.
The same signature appears at much finer resolution. Splitting the portfolio by industry instead of by size and term, all nineteen two-digit NAICS sectors carrying 200 or more loans in both years show defaults higher and prepayments lower in 2025 than in 2019. There are no exceptions. Measured against each sector's own 2015 to 2019 average instead, defaults are higher in eighteen of nineteen and prepayment lower in fifteen, so the result is weaker on that basis but not close to reversing. Prepayment declines run from 0.4 points in Finance and Insurance to 4.3 points in Real Estate, and every sector's default rate rose. Nineteen industries with different demand conditions, collateral profiles, and cycles do not invert together because origination standards shifted. They invert together because what changed was not particular to any of them: the cost of carrying the debt, and the availability of a way out of it.
Whether falling prepayments signal borrower distress or simply a reaction to high rates, the balance sheet consequence is the same. Loans that do not leave a portfolio extend its weighted average life, and a book built on historical prepayment assumptions is now running longer than those assumptions imply, with the effects on liquidity forecasting, rate positioning, and the pricing of any paper sold on. A reader who attributes the entire decline to interest rates and rejects the distress reading, or who takes the opposite view, still holds an asset behaving differently from the model of it.
The 2019 base flatters the four-bucket table, and the discipline this analysis applies to the bank series applies here too. Prepayment on the largest, longest credits ran 7.76%, 8.37%, 9.09%, 10.56%, and then 13.02% across 2015 to 2019, so the final year was the top of a climb rather than a normal reading. Against the five-year average of 9.76%, the 2025 figure of 9.91% sits marginally above it.
Measured against the 2015 to 2019 expansion, the four buckets separate rather than move together:
Bucket | Default vs expansion average | Prepayment vs expansion average |
|---|---|---|
Under $1M, under 15 years | +1.41 | −2.34 |
Over $1M, under 15 years | +1.54 | −0.55 |
Under $1M, 15 years and over | +0.76 | +0.51 |
Over $1M, 15 years and over | +1.24 | +0.15 |
Defaults are higher in all four. Prepayment is lower on short paper and holds on long paper. The exit closed selectively. It closed for the borrowers on short amortization, who are also the borrowers defaulting at the highest rates and, in percentage points, rising the fastest. Term structure sorts both outcomes, and it sorts them the same way.
That also settles an apparent disagreement with our own earlier work. Our analysis of SBA 7(a) prepayment speeds reports that large, long, secured borrowers still have a working exit. Measured against the last expansion rather than against 2019, this data says the same thing. The two pieces agree on the borrowers and differ only on the base year.
Part of the short-paper decline is a rate effect, not a distress signal. Prepayment in this portfolio comes from business sales and acquisitions, and expensive acquisition financing suppresses those transactions regardless of how the seller is performing. The decline is not the lock-in that is familiar in residential mortgages, where borrowers sit on cheap fixed-rate debt rather than refinance into a costlier one. The vast majority of 7(a) credit carries a variable rate that adjusts quarterly, so existing borrowers repriced upward along with everyone else and hold no below-market loan worth protecting.
The timing argues against rates as the primary driver in any case. Prepayment reached 14.62% in 2022, the highest annual reading in thirty years, during the fastest tightening cycle in forty. That peak was itself unusual, and pandemic-era liquidity almost certainly contributed: forgiven relief loans and accumulated cash left many borrowers able to retire debt early, and the market for buying and selling businesses was strong. Measuring a decline from an inflated peak would overstate it, which is why the comparison here runs against the 2015 to 2019 expansion instead, when prepayment averaged 10.95%. Calendar 2025 came in at 9.66%, below the pre-pandemic norm rather than merely below a bubble, and the trailing twelve months to March 2026 read 9.34%.
Prepayment then fell in each of the three years after 2022, including 2025, when the average prime rate declined and defaults continued to rise. A rate story predicts relief as rates ease. What the data shows instead is prepayment falling below its pre-pandemic norm while defaults reached their highest level in the window.
Term structure sorts the level of risk decisively. Restricting the portfolio to loans of twenty-five years and longer and comparing against the whole book on an identical measure, the long-term book defaulted at 0.89% in 2025 against 3.83% for the portfolio, and in all sixteen sectors carrying 200 or more such loans the long-term book performed better. There were no exceptions. Those loans are also larger, averaging about $1.31 million against about $544,000 across the portfolio on a loan-weighted basis, so loan size works against the finding rather than for it. Part of the explanation is arithmetic: amortizing a balance over twenty-five years instead of ten produces a much smaller monthly payment, so the borrower carries less debt service against the same cash flow and a rate rise moves that payment by less. The rest is what the paper is secured by, since twenty-five year amortization on SBA credit generally means real estate.
Immunity is another matter. Longer amortization lowers the payment but raises the sensitivity. On a $1 million loan at a note rate equal to prime, a move from 5% to 9% lifts the monthly payment on ten-year paper by about 19%, and on twenty-five year paper by about 44%. With a spread over prime the percentages are smaller, and the ordering is unchanged. The long-term borrower absorbs the larger shock, in dollars as well as in percentage terms. What protects that borrower is not insulation from the move but the level they started at: after the increase, the twenty-five year payment is still roughly a fifth below what the ten-year borrower was paying before rates moved at all.
Both consequences show up in the data, and they point in opposite directions. The long-term book stands at 2.53 times its 2015 to 2019 average while the full portfolio stands at 1.60 times its own, which is the sensitivity showing through. In percentage points, though, the long-term book rose 0.54 against the portfolio's 1.44, so the advantage compressed rather than closed. The same shape appears in the size and term table above. Read as multiples the fifteen-year buckets look worse; read in points they moved 0.83 and 0.96 against 1.08 and 0.90 for short paper, which is no gap at all.
A multiple computed off a very low base exaggerates, which is the objection this analysis raised against the aggregate series and applies here to its own. What separates long-term paper from shorter paper is magnitude, not direction, and the magnitudes are best read in points.
That advantage has limits. On a $5 million loan at twenty-five years, the same move in prime adds roughly $153,000 to annual debt service. The protection is smaller than the default rates alone suggest.
Lender results separate the same way. Across the lender panel, 194 with a 2019 reading and 199 by 2025, the median conditional annual default rate rose from 1.99% to 3.14%. The 2021 reading of 0.98% would make a more dramatic comparison and is not used here, for the same reason the bank series are read against 2015 to 2019: relief lending suppressed it. A common shock moves a distribution without changing its width. This one widened as it moved, and the widening came from one end. Against 2019, the ninetieth percentile rose 2.32 points to 7.26% while the tenth rose 0.51 points to 0.51%, and the number of lenders reporting no defaults at all fell from 31 to 13. Portfolio size does not order the outcome. The interquartile spread is roughly the same for lenders under $500 million, between $500 million and $1 billion, and above $1 billion.
Uniform borrowers would have moved as a block. These stretched.
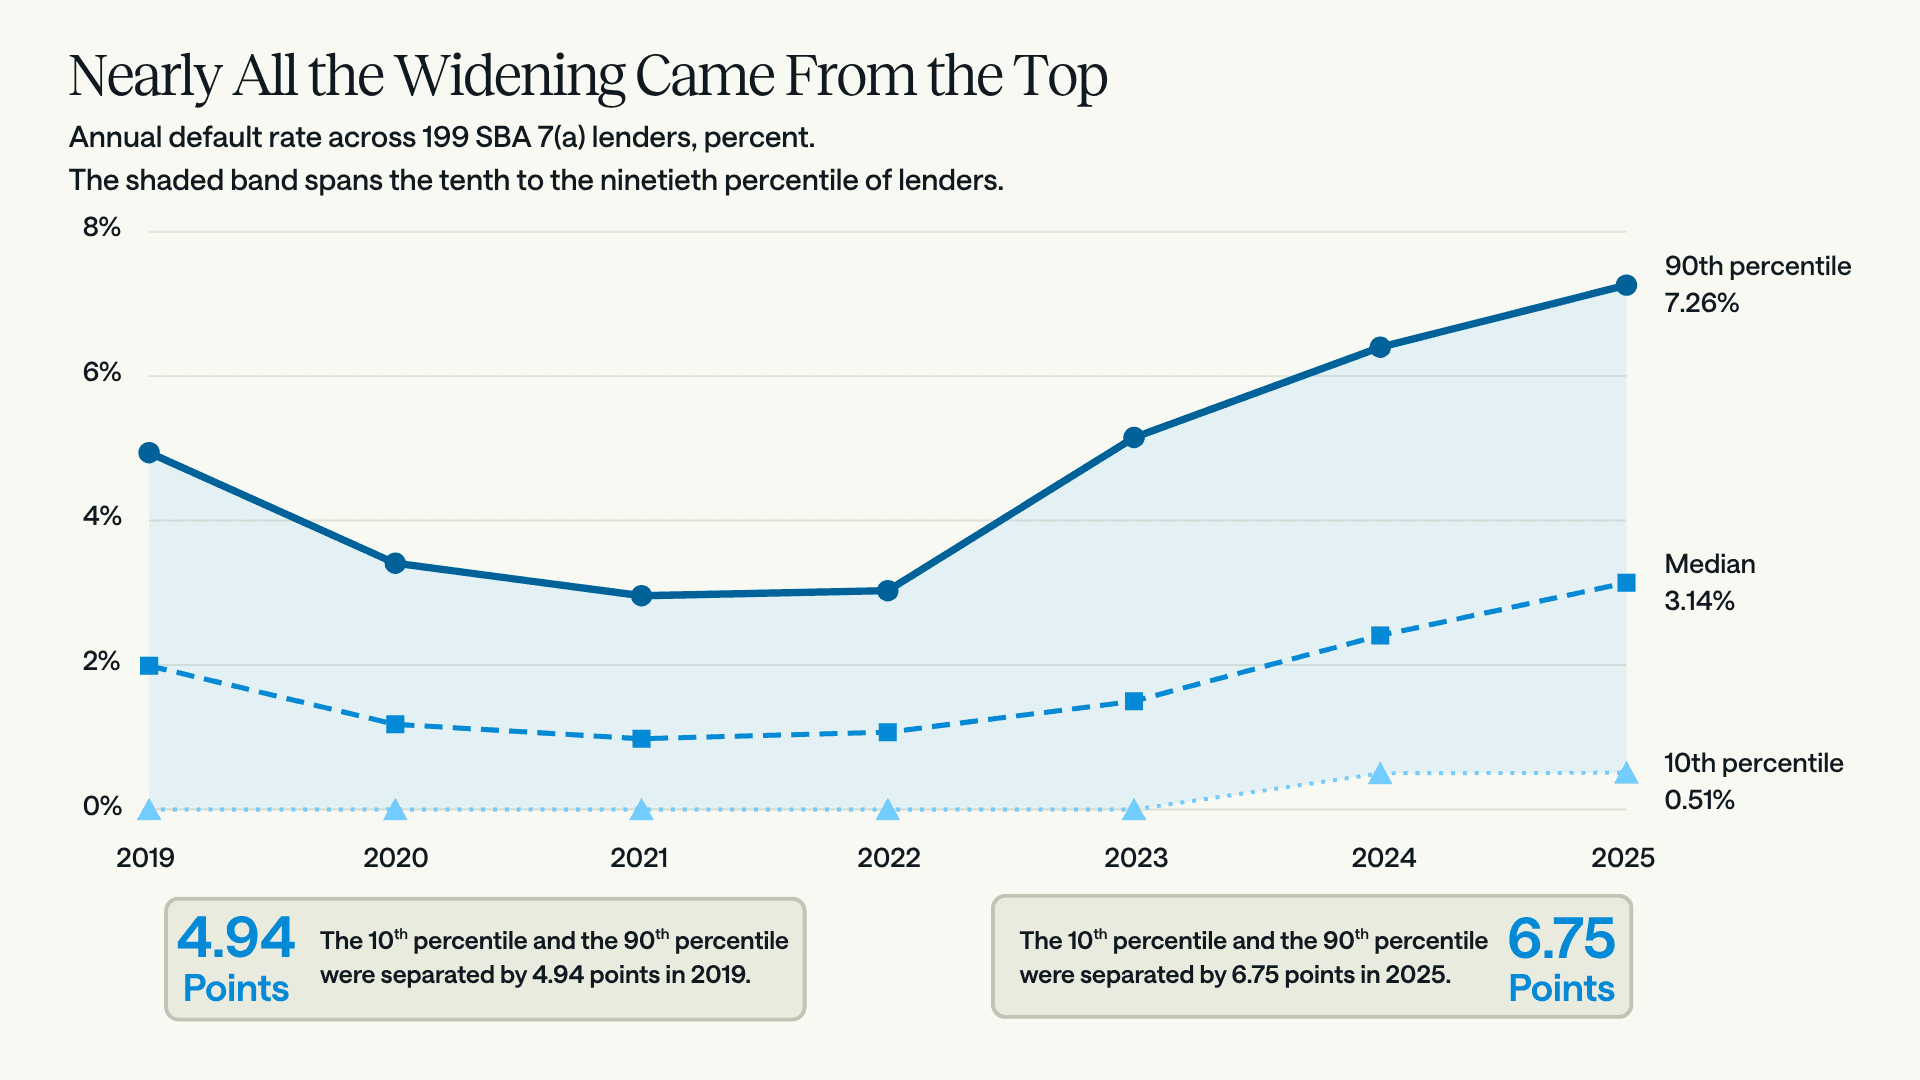
Lender default rates, 2019 to 2025. The distribution shifted and stretched. Against 2019, the ninetieth percentile rose 2.3 points while the tenth rose half a point, so nearly all of the widening came from lenders already performing worst. Source: Lumos analysis of the Lumos SBA 7(a) lender panel, 194 lenders with a 2019 reading and 199 by 2025, reporting conditional annual default rates.
Four independent cuts of the same book point the same way: size and term, industry, amortization, and lender. Consistency is not proof, and three serious arguments hold that all of it could mean something else.
Three Ways This Could Be Wrong
The first is that the 7(a) population is not constant from year to year, so a trend inside it may be a trend in who borrows rather than in how borrowers are doing. Program terms changed across the window through fee adjustments, revisions to the standard operating procedures, and a retreat from the smallest loans. A fourth source of variation sits inside the program rather than in its rules. Participating lenders operate very different credit boxes, which is what the dispersion above is showing: a spread that wide is not one risk appetite applied consistently. The population is therefore a blend of credit standards rather than a single standard, and a change in which lenders originate the most volume moves that blend without any rule changing. Mix shift within a defined group is a live concern for a trend claim, and it is the strongest of the three objections here.
Three things weigh against it. The lender dispersion argues against a uniform policy shock, which would shift the distribution without stretching it, and this one moved and widened one-sidedly. The term structure result points to a cause that shifting approval standards cannot explain. If this were really about which borrowers were being approved, the length of a loan would have no particular bearing on whether it survives. It has a great deal, and it holds inside each industry, where the mix of borrowers is far steadier than across the portfolio as a whole. And Lumos has validated origination scoring on a non-SBA book of 88,917 applications across five lenders, where predicted probability of default on new originations rose from below 0.5% on 2019 through 2021 vintages to above 1.5% on 2024 and 2025 vintages, the same direction on conventional paper with no program to blame. That last piece should be weighed for what it is. Predicted default at origination is not realized default on a seasoned book, and seasoned conventional small business performance is not published by anyone, so it remains unobserved rather than merely uncited. It establishes that the trajectory is not a creature of the guaranty; it does not establish that the two populations deteriorated by the same amount. That work is set out in our conventional loan performance analysis.
A broader version of this objection is sometimes raised and does not hold. It runs that because 7(a) selects its borrowers by statute, any finding inside the program is a program effect rather than a small business effect. But the selection criterion is informative in its own right. Eligibility turns on the credit elsewhere test, which requires that the borrower could not obtain credit on reasonable terms from a non-federal source, so the population is weighted toward firms that lacked the financing alternatives which insulated larger borrowers through the rate cycle.
That does not place any particular borrower in either leg. Which leg a firm sits in is a question of how it came through the cycle, not of what kind of loan it holds, and plenty of businesses with 7(a) credit came through intact. What the eligibility test does is make this a sensible population in which to look for the lower leg, if one exists. Membership in the population is defined; performance within it is measured, and measured against the same population in earlier years, which is what makes a trend inside it meaningful rather than circular.
The second objection is that larger borrowers are not holding up, only lagging. This cannot be dismissed from the aggregates, for all the reasons above. The evidence against it comes from the one mainstream instrument that splits by borrower size rather than by lender size. In the January 2026 Senior Loan Officer Opinion Survey, banks were asked how they expected delinquencies and charge-offs to behave across 2026 on their own commercial and industrial books, split by borrower size. They expected quality to hold at current levels for large and middle-market firms and to deteriorate for small firms, which the survey defines as those with annual sales under $50 million. The deterioration expectation came from a moderate net share of respondents rather than an overwhelming one. That is lenders describing their own portfolios, separating the two groups directly, and expecting them to move apart. The survey asks about banks' own commercial and industrial books, which are overwhelmingly conventional lending, so the divergence those lenders expect is one they expect to see on credit they originate themselves. The panel is weighted toward large domestic banks, so it describes their books rather than a community lender's.
With the delinquency and charge-off series set aside, that survey is close to the only bank-level evidence on the question in either direction. It reports expectations rather than outcomes, and it is the nearest thing to a direct test the published data offers.
If a frightening consumer credit number turned out to be a reporting artifact, and if part of the small business prepayment decline is a rate effect rather than distress, why should the central finding here be treated as real?
The answer is in what kind of measure it is. The credit card series that misled was a running total: balances piling up in a numerator, growing because of how long they stayed on the books rather than because of how often borrowers failed. Any running total is open to that kind of distortion, and a running total is what this analysis declined to build its case on. Defaults rising while prepayments fall is a statement about movement, in two directions, on the same loans in the same period. Loans are leaving the portfolio through the failure exit at a higher rate and through the payoff exit at a lower one. No accounting practice, reporting convention, or denominator change moves those two in opposite directions at once, which is why the combination is rare enough to have occurred only once before in a record that begins in 1996.
The same standard was applied to the loan-level data throughout, which is why the base-date table appears at all and why the charge-off series is reported despite complicating the story.
Debt Structure, Not Loan Size: Why Small Businesses Repriced First
Large borrowers had access to the corporate bond market through 2020 and 2021 and refinanced into fixed-rate paper at long maturities. When prime moved from 3.25% to 8.5%, their debt service followed slowly. Small businesses have no bond market, and as noted above, the credit examined here is overwhelmingly variable and quarterly adjusting, so it repriced immediately and in full. We have not measured the issuance side directly. The corporate half is the explanation we find most plausible, and it is offered on that footing. Rate structure is the channel through which scale operates here, not an alternative to it, since the reason small firms hold floating bank paper is that they cannot issue bonds. A small business holding fixed-rate debt would behave differently, and that split is not reliably observable in this data.
The half that is measured sits inside the program. Borrowers financing depreciating assets on short paper did worst, and those holding long, secured paper did best, in every sector tested. That is the same structure operating at small business scale.
What This Means for a Small Business Portfolio
At Lumos we do not forecast the macro economy, and nothing here is a call on where credit conditions go next.
The claim is narrower and it is about measurement. A small business book benchmarked against C&I aggregates is being graded against a population its borrowers are not in, and the gap runs in the direction that understates risk. The aggregate is weighted toward facilities large enough to dominate the balances, which is to say toward the borrowers who could refinance in 2020 and did. Read that way the series are not useless. C&I delinquency sitting inside its expansion range is real evidence that larger borrowers are contained. It is evidence about the other group.
That error does not stay abstract. A benchmark that runs low feeds everything built on top of it, from loss forecasts to pricing to capital planning, and it runs lowest for exactly the borrowers the aggregate can least see.
None of this turns on the guaranty. A conventional small business book written largely in facilities under $1 million sits in exactly the slice the framework counts for volume and never for performance, so it is misaligned with a C&I benchmark for the same reason a 7(a) book is. By how much, in either case, is what the framework cannot show, which is the whole difficulty. The mechanisms behind the loan-level findings are not program features either. Amortization length and the availability of an exit operate on conventional paper as they do here, and floating-rate repricing does so to the extent the paper floats, which on conventional small business credit varies more than it does in 7(a).
So a book performing in line with C&I aggregates is not, for that reason, performing in line with its peers. Distinguishing the two requires performance data at loan level, on the actual borrowers, which is what the reporting framework declined to collect in 1991 and has not collected since. The general question of how to measure small business credit risk is treated in our guide to small business credit risk, and the current 7(a) default reading in our analysis of SBA default rates. Readers who want the underlying numbers by industry, including the sector-by-sector default and prepayment figures behind the nineteen-sector result above, will find them in our small business default rates by industry benchmark.
Whether all of this amounts to a K is the wrong question to put to the Call Report and the published series built on it, and the right one to put to the loans. Large corporate and small business credit both deteriorated from the relief-suppressed lows of 2021. What separates them is how far, how fast, and whether the exit stayed open. On the evidence that can actually tell them apart, the exit closed for the borrowers on short paper.
Frequently Asked Questions
Is there a K-shaped economy in small business credit?
Public bank data cannot answer that, in either direction. Delinquency and charge-off series are stratified by the size of the bank rather than the size of the borrower, and the answer they give changes with the starting point and the measure chosen. Loan-level data points to a divergence: small business defaults have risen against their last-expansion level in every size and term bucket and in eighteen of nineteen industry sectors, while the prepayment exit has narrowed for borrowers on short amortization. What separates large corporate credit from small business credit is the magnitude and speed of the move, and whether the exit stayed open. Both groups deteriorated from the relief-suppressed lows of 2021. Small business borrowers repriced immediately on floating-rate paper, and at the same time the routes that would once have let a struggling borrower sell or refinance narrowed.
Why can a small business delinquency rate not be calculated from the Call Report?
Schedule RC-C Part II reports small business loans by original amount, so volume is stratified by size. Schedule RC-N, which reports past due and nonaccrual balances, carries no size stratification at all. Delinquency is published at the aggregate commercial and industrial level and nowhere below it. The two halves cannot be joined, and no adjustment to the published series recovers what was never collected.
What does a prepayment decline mean for duration and liquidity assumptions?
Portfolio-wide prepayment has fallen from a 2015 to 2019 average of 10.95% to 9.66% in 2025, with the decline concentrated in short-term paper. Loans that do not leave a portfolio extend its weighted average life, so a book built on historical prepayment behavior is running longer than those assumptions imply, with knock-on effects for liquidity forecasting and rate positioning. This holds regardless of interpretation. A team that reads the decline as a rate reaction rather than borrower distress still holds an asset behaving differently from the model of it.
Can aggregate C&I delinquency be used to set small business reserves?
It can be used, and it describes a different population than the one being reserved against. C&I delinquency across all commercial banks reads 1.34%, and roughly four fifths of the balances behind that figure are loans over $1 million. Over the same period the loan-weighted 7(a) default rate ran about 60% above its 2015 to 2019 expansion average, and the median result across 199 lenders rose by more than half against its pre-pandemic level. Whether that gap is material to a particular allowance depends on the book, the methodology, and the qualitative adjustments already applied. The point is narrower: the benchmark and the portfolio are not drawn from the same population, and the difference runs in the direction that understates.
If loan size does not predict risk, what does?
Across sectors, average term has a strong relationship with default rates. Loan size has none once term is controlled for. Long-term loans default at roughly a quarter of the portfolio rate on this measure, 0.89% against 3.83% in 2025, because amortizing over twenty-five years rather than ten leaves a much smaller payment against the same cash flow. The size of the gap depends on how the rate is built, and on other constructions it is nearer a half; what does not change is that the long-term book performs better in every sector tested. The same length makes those borrowers more rate-sensitive, so a move in prime costs them proportionally more, and their advantage compressed as rates rose without closing. For an origination or pricing team the practical reading is that term structure and debt service headroom carry more information about survival than loan size does.
Does this apply to conventional small business lending, or only to SBA?
The loan-level evidence here is SBA 7(a), and eligibility for that program turns on the credit elsewhere test, so the population is defined by constrained access to conventional credit. Lumos has validated origination scoring on a non-SBA book of 88,917 applications across five lenders, where predicted default on new originations rose roughly threefold between the 2019 to 2021 and 2024 to 2025 vintages. That establishes the same direction on conventional paper. It does not establish that both populations deteriorated by the same amount, and seasoned conventional small business performance is not published by anyone.
Are community and regional banks more exposed than large banks?
More exposed, but not worse performing. Small business credit is a larger share of the balance sheet at institutions that concentrate in the segment, and those institutions are less likely to hold loan-level benchmarking of their own, so the measurement gap costs them more. Performance is a separate question. Across 199 SBA lenders, portfolio size did not order the outcome, and the spread of results was about as wide inside each asset-size tier as across the panel.
Sources and Methods
Figure | Source and measure |
|---|---|
Bank delinquency and charge-off baselines, Q1 2026 readings, Q2 2020 inversion, base-date table |
|
Small business share of C&I, PPP balance round trip | FDIC Quarterly Banking Profile time series, Small Business-Farm Loans tab; June readings used throughout for consistency |
Absence of size stratification in performance | Same source, Loan Performance tab; no row carries a dollar threshold |
Four-bucket default and prepayment, 2019 and 2025 | Lumos 7(a) performance history, cut by loan size and original term; exposure-adjusted annual rate, loan-weighted |
Competing-risks episodes, portfolio-wide | Lumos 7(a) performance history, monthly default and prepayment by original term; loan-weighted across seven buckets, annual mean of monthly rates |
Sector competing-risks test, 19 of 19 | Lumos 7(a) performance history, sector cut; default and prepayment on the exposure-adjusted annual rate, calendar basis, 200-loan minimum in both years. Holds 17 of 19 on a fiscal basis |
25-year book against full book, sector test | Lumos 7(a) performance history, full portfolio and the twenty-five year cut; exposure-adjusted annual rate on both sides |
Lender dispersion | Lumos SBA lender panel, 199 lenders, conditional annual rates |
SLOOS expectations split | Federal Reserve Board, January 2026 Senior Loan Officer Opinion Survey |
Credit card stock and flow delinquency reconciliation | Lee, Mangrum, Scally, Sinha, and van der Klaauw, Liberty Street Economics, Federal Reserve Bank of New York, August 11, 2026 |
RC-C Part II and RC-N scope | FFIEC 031/041 instructions; FDICIA 1991 Section 122 |
Conventional validation, prime path, rate type | Published Lumos analyses; SBA program characteristics |
Measure conventions held throughout. Definitions for every measure named here, and how they reconcile to each other, are set out in our guide to how Lumos measures default and prepayment. Bank series are seasonally adjusted quarterly readings anchored on the 2015 to 2019 expansion. SBA figures come from two constructions that are never crossed: the exposure-adjusted annual rate, used for the size and term table, the sector figures, and the 25-year comparison; and the rolling term-bucket rates, used for the competing-risks episodes. Levels are never compared across a delinquency measure and a default measure.
Book a 30-minute demo. No pressure, no sales pitch. Just a straightforward conversation about whether Lumos is right for you.
What To Expect:
Quick platform overview
Live demo with real loan examples
Discussion of your specific needs
Clear next steps
"The data and insights provided by Lumos have been instrumental in driving numerous policy changes within our organization."
VP, Senior Product Manager, US Bank

" height="29.26525980811059px" id="Eth71R0cp" transform="translate(50.52 7.877)" width="128.4356838868068px"/><path d="M 11.504 26.662 C 13.336 26.98 15.177 27.241 17.025 27.445 C 17.285 29.224 17.589 31.249 17.922 33.01 C 19.147 32.283 21.153 30.675 22.427 29.793 C 23.831 30.749 25.613 32.22 26.99 33.03 C 25.815 36.077 24.734 39.17 23.558 42.217 C 23.29 42.912 22.993 43.872 22.596 44.483 C 21.955 44.554 21.761 43.465 21.609 42.971 C 20.391 40.097 18.964 36.046 17.872 33.065 C 16.793 33.66 7.128 38.055 6.752 38.016 C 6.687 38.009 6.584 37.851 6.538 37.796 C 6.428 37.314 9.351 31.438 9.748 30.419 C 10.07 29.592 11.059 27.547 11.504 26.662 Z M 33.315 17.665 C 33.811 17.67 44.337 21.602 44.765 21.893 C 44.829 22.154 44.823 22.057 44.743 22.33 C 44.2 22.746 41.332 23.727 40.478 24.044 L 33.378 26.673 C 33.931 27.703 34.585 29.232 35.077 30.314 L 37.921 36.591 C 38.139 36.993 38.577 37.669 38.215 38.059 C 37.576 38.025 28.285 33.71 27.005 33.081 C 27.245 31.226 27.527 29.375 27.852 27.532 C 29.68 27.191 31.452 27.024 33.361 26.642 C 32.387 25.285 31.08 23.402 30.028 22.145 C 31.145 20.668 32.241 19.174 33.315 17.665 Z M 11.47 17.635 C 12.542 19.071 13.786 20.686 14.782 22.158 C 13.751 23.535 12.423 25.259 11.471 26.662 C 7.932 25.41 3.445 23.785 0 22.375 L 0 21.889 C 0.606 21.563 4.34 20.21 5.18 19.923 C 6.787 19.373 10.005 17.985 11.47 17.635 Z M 38.174 6.263 C 38.651 6.647 36.872 9.988 36.559 10.642 C 35.557 12.85 34.425 15.506 33.354 17.637 C 31.433 17.286 29.758 17.057 27.819 16.83 C 27.504 14.962 27.219 13.088 26.965 11.21 C 28.001 10.653 37.733 6.247 38.174 6.263 Z M 11.501 17.628 C 11.491 17.63 11.481 17.633 11.47 17.635 C 11.467 17.63 11.463 17.625 11.459 17.62 C 11.47 17.617 11.482 17.615 11.493 17.613 C 11.496 17.618 11.498 17.623 11.501 17.628 Z M 6.584 6.275 C 7.178 6.118 16.533 10.566 17.901 11.193 C 17.626 12.874 17.196 15.105 17.02 16.753 C 15.137 17.022 13.363 17.27 11.493 17.613 C 10.01 14.74 8.822 11.568 7.374 8.666 C 7.162 8.243 6.391 6.664 6.584 6.275 Z M 25.57 7.432 C 25.913 8.348 26.716 10.341 26.965 11.21 C 26.335 11.545 23.197 13.924 22.45 14.47 C 20.941 13.448 19.381 12.27 17.901 11.193 C 18.006 10.669 18.713 8.998 18.925 8.369 C 19.829 5.694 21.248 2.668 22.023 0 L 22.788 0 Z" fill="rgb(28, 26, 26)" height="44.486082377664px" id="u84SiQ2Nx" transform="translate(0 0.255)" width="44.80873390361835px"/></svg>)