
Conventional Small Business Loan Default Rates by Vintage: Results from a Five-Lender Lumos Prime+ Validation
Brett Caines
Between 2019 and 2025, five conventional business lenders originated the loans that make up this analysis, and over that period the default risk Lumos Prime+ predicts on their new originations more than tripled. The same model, run across the same five portfolios, also placed roughly half of all historical defaults inside the riskiest fifth of applications.
This is the full set of results behind those two statements, with every origination year reported separately rather than rolled into an average. The evaluation covered 88,917 applications, and the result that carries furthest is where the model placed the loans nobody booked.
What Was Tested
A conventional business loan, for the purposes of this analysis, is a small business loan a lender holds on its own balance sheet without a government guarantee, which distinguishes it from the SBA 7(a) and 504 lending that most published small business credit research describes.
Lumos Prime+ predicts three measures over the full life of a loan: the probability that it defaults, the share of exposure not recovered if it does, and the expected loss those two imply. This validation tested the first of the three. Probability of default, or PD, is the likelihood a loan fails to perform over a stated horizon, and the horizon here is the loan's lifetime rather than the next twelve months. What counts as failing to perform is less uniform than the phrase suggests. The loans Lumos Prime+ learned from carry default indications set at 60, 90, or in some cases 120 days past due, depending on the institution that recorded them. The model has never been fitted to a single convention. The other two, loss given default (LGD) and expected loss (EL), were not evaluated in this study, and no claim about their accuracy should be read into what follows.
Five conventional business lenders contributed loan-level data. Each provided at least 500 loans containing at least 10 defaults, with four of the five providing more than 40 defaults, and each provided at least 15 declined applications, with four of the five providing more than 100. The pooled sample came to 88,917 applications: 54,538 that the lenders declined and 34,372 that they approved. Within the approved loans, 792 had defaulted at the time of analysis, a default rate near 2.3% that indicates how imbalanced this prediction problem is. On that approved book, a model that predicted no defaults at all would be right about 97.7% of the time and useless.
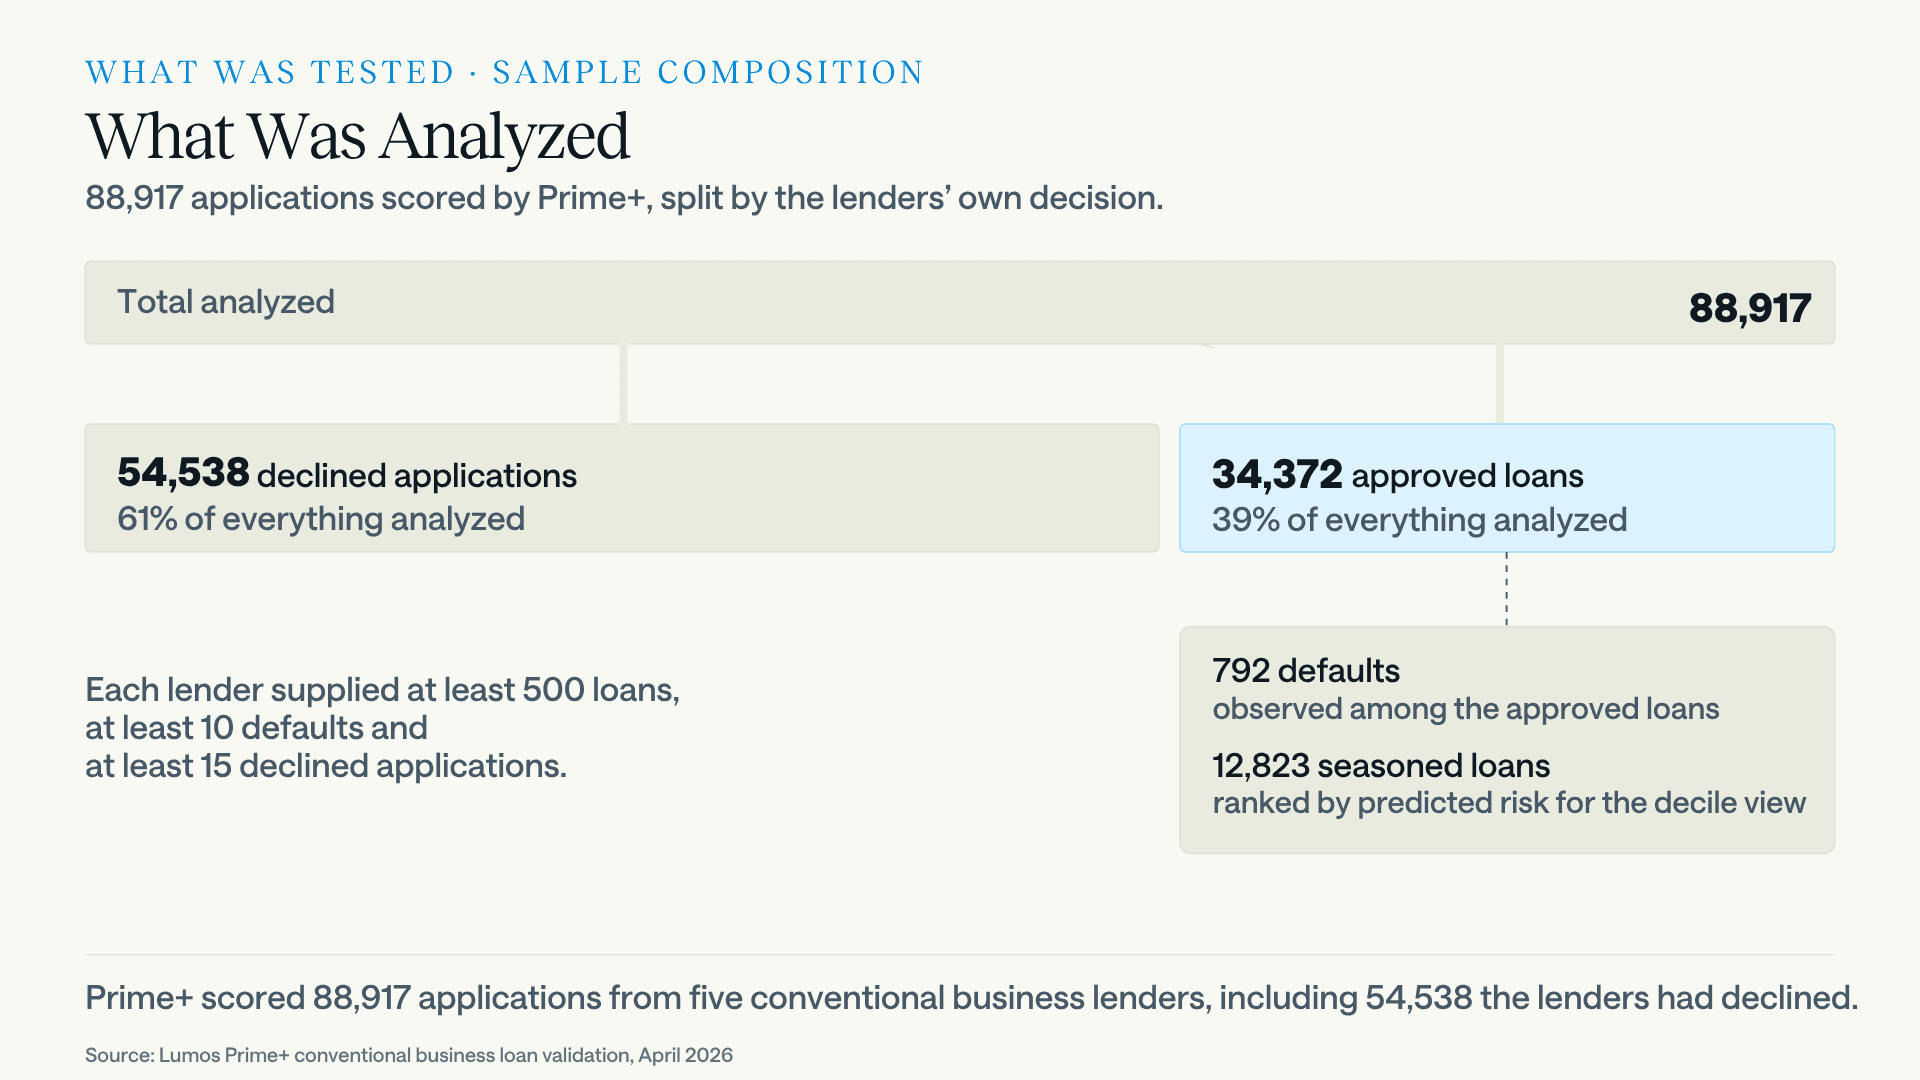
Every application was scored by Lumos Prime+ and sorted into four groups: applications the lender declined, approved loans that later defaulted, approved loans still performing after less than three years, and approved loans still performing after three years or more. Seasoning, the age of a loan relative to the window in which defaults typically occur, is the reason for that last split. The three-year line is where these portfolios begin to show most of their eventual failures.
Where the Model Placed Each Group
Across the pooled sample, the loans already known to have defaulted drew the highest median predicted PD of the four groups. Loans still performing after three years or more drew the lowest. That ordering is the basic result, and it holds in the direction a working model requires.
The two middle groups are the interesting ones. Unseasoned performing loans, which had not yet had time to fail, were scored closer to the known defaults than to the seasoned performers. On a twelve-month model that pattern would look like error. On a lifetime model it is the point, because a loan that is eighteen months old and current has not survived its risk period, it has not reached it yet. A shorter-horizon model would score those same loans as safe and be wrong about them later.
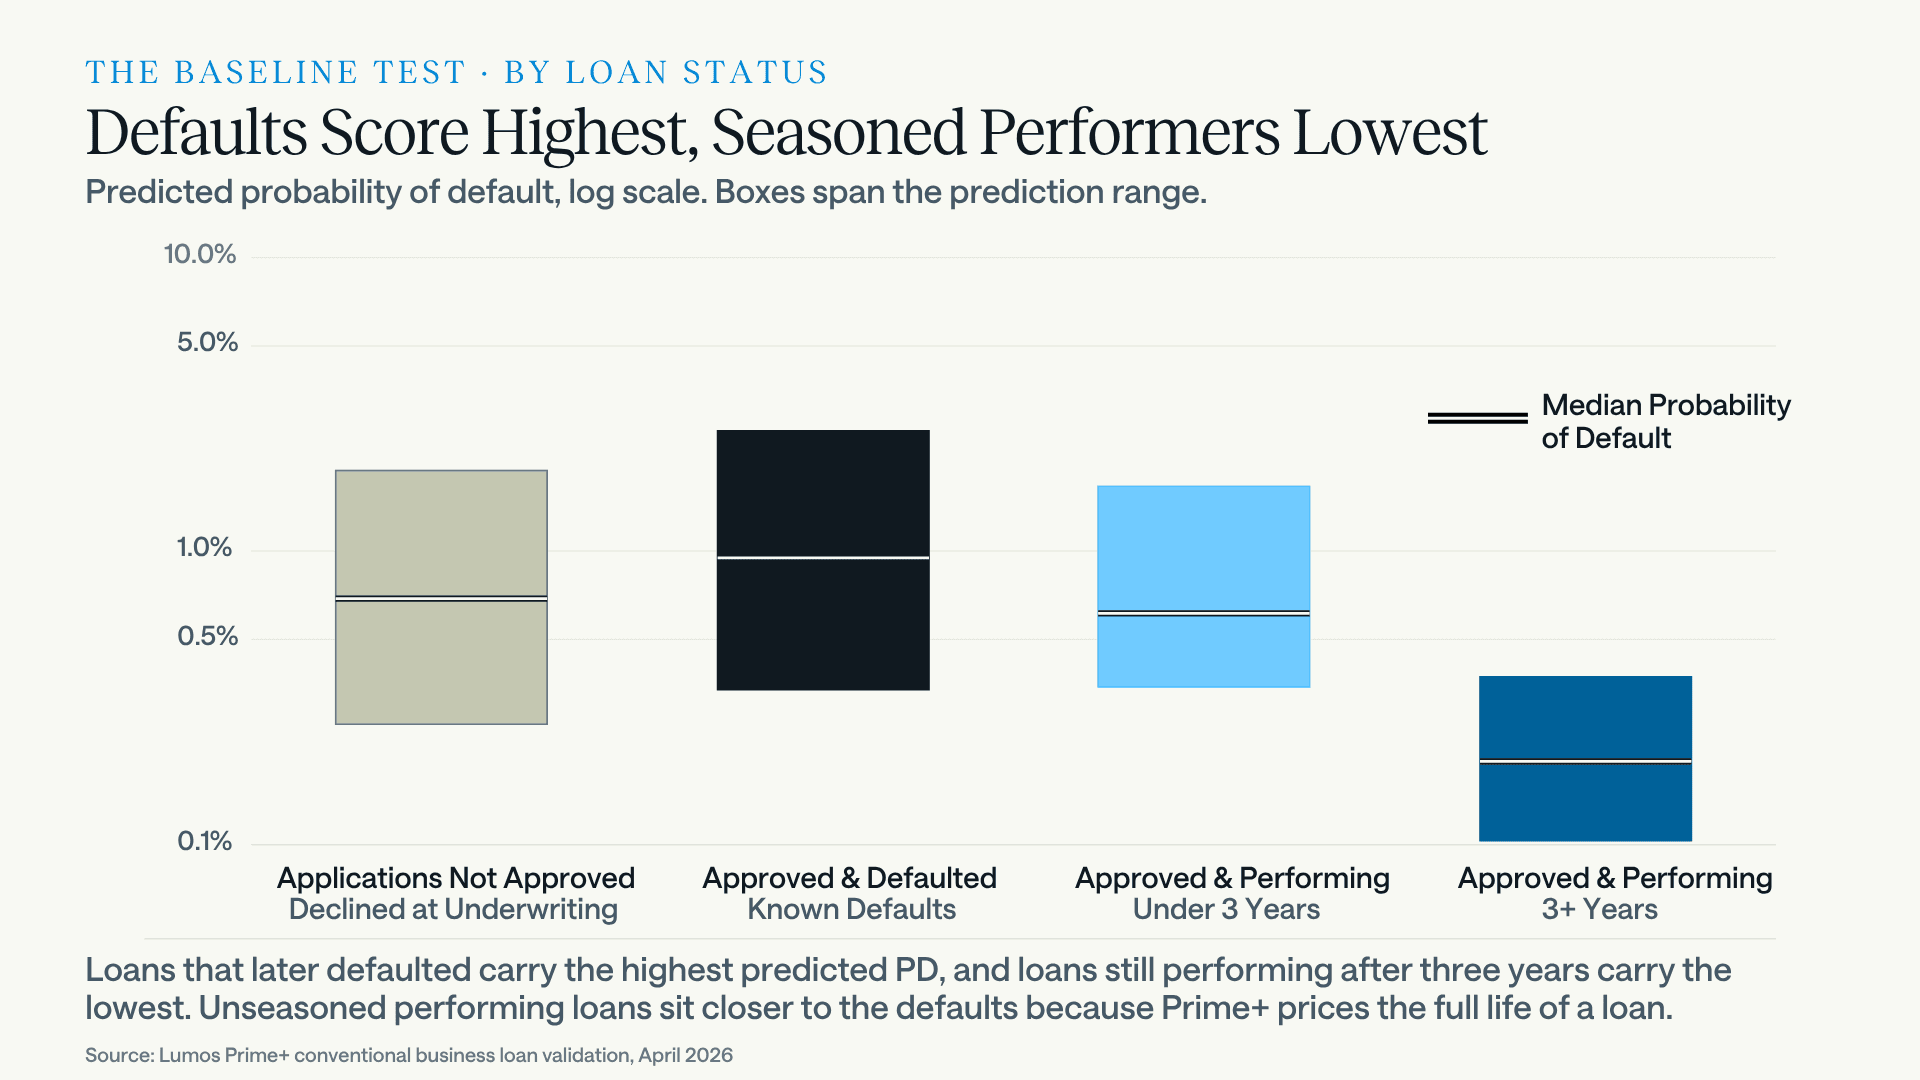
Declined applications behaved differently depending on how the data is cut, and the difference is worth stating precisely rather than smoothing over. Within each individual lender's portfolio, declined applications generally drew the highest predicted PDs of any of the four groups. Pooled across all five lenders, the defaulted loans drew the highest. Both statements are accurate. The most plausible reconciliation is that the five lenders operate at widely different average risk levels, so pooling their applications mixes populations whose scores are not directly comparable, and the per-lender view is the more meaningful one for a lender assessing its own book.
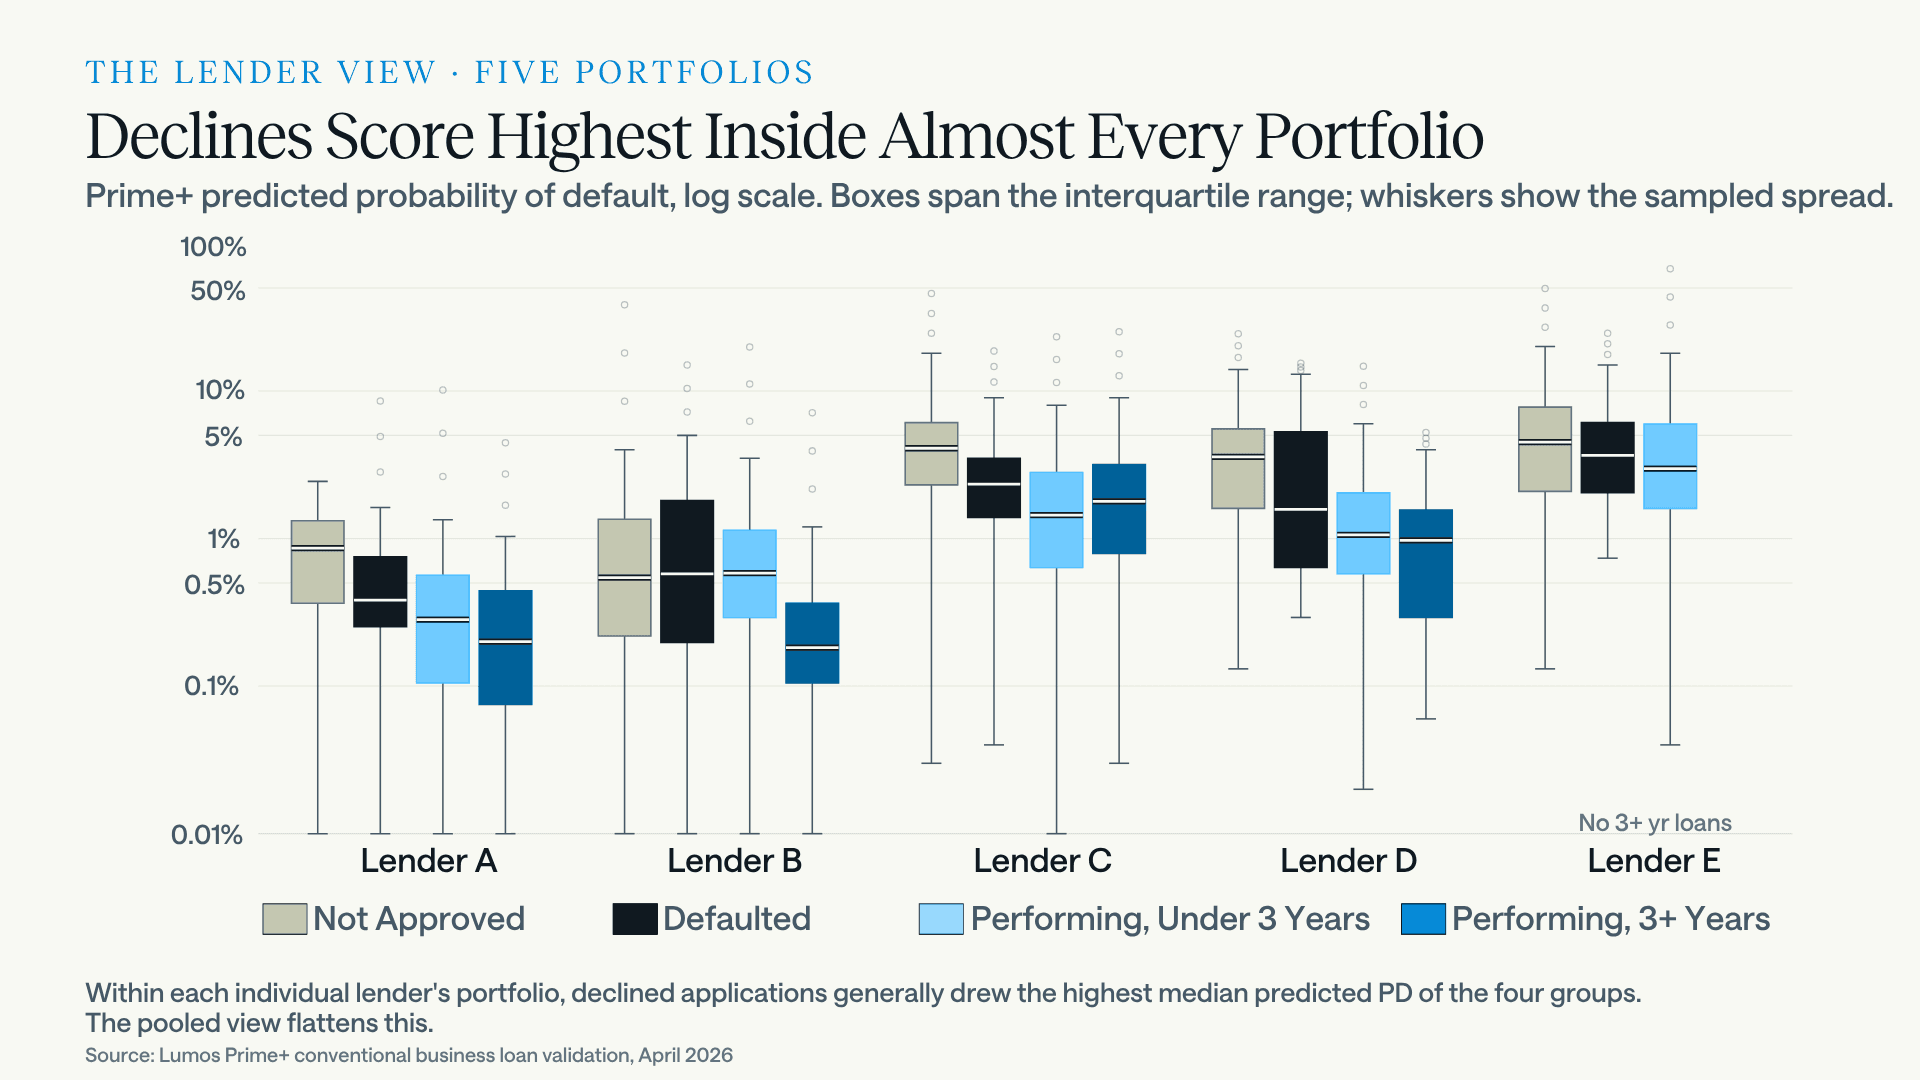
That per-lender result is the finding that speaks to underwriting. The model was never shown the outcome of any credit decision, and it independently assigned its highest risk scores to the applications each lender's underwriters had already turned down. Lumos Prime+ agreed with those underwriters using none of the judgment, relationship history, or narrative context they had. Reaching an underwriter's conclusion from loan and borrower data alone is what makes credit judgment repeatable across a portfolio, across underwriters, and across time.
Default Concentration in the Seasoned Portfolio
Ranking matters more than the absolute scores, because a lender acts on order rather than on levels. To test ordering, the 12,823 seasoned loans in the sample were sorted by predicted PD and divided into ten equal groups.
Defaults were not spread evenly across those ten groups. The riskiest decile by Lumos Prime+ ranking contained 35% of every default in the seasoned portfolio, and the second riskiest contained a further 13%. Performing loans, by construction, sat at roughly 10% per decile. The share of defaults rose steadily across the ranking rather than jumping only at the end, which is what separates a model that genuinely orders risk from one that merely flags a handful of obvious failures.
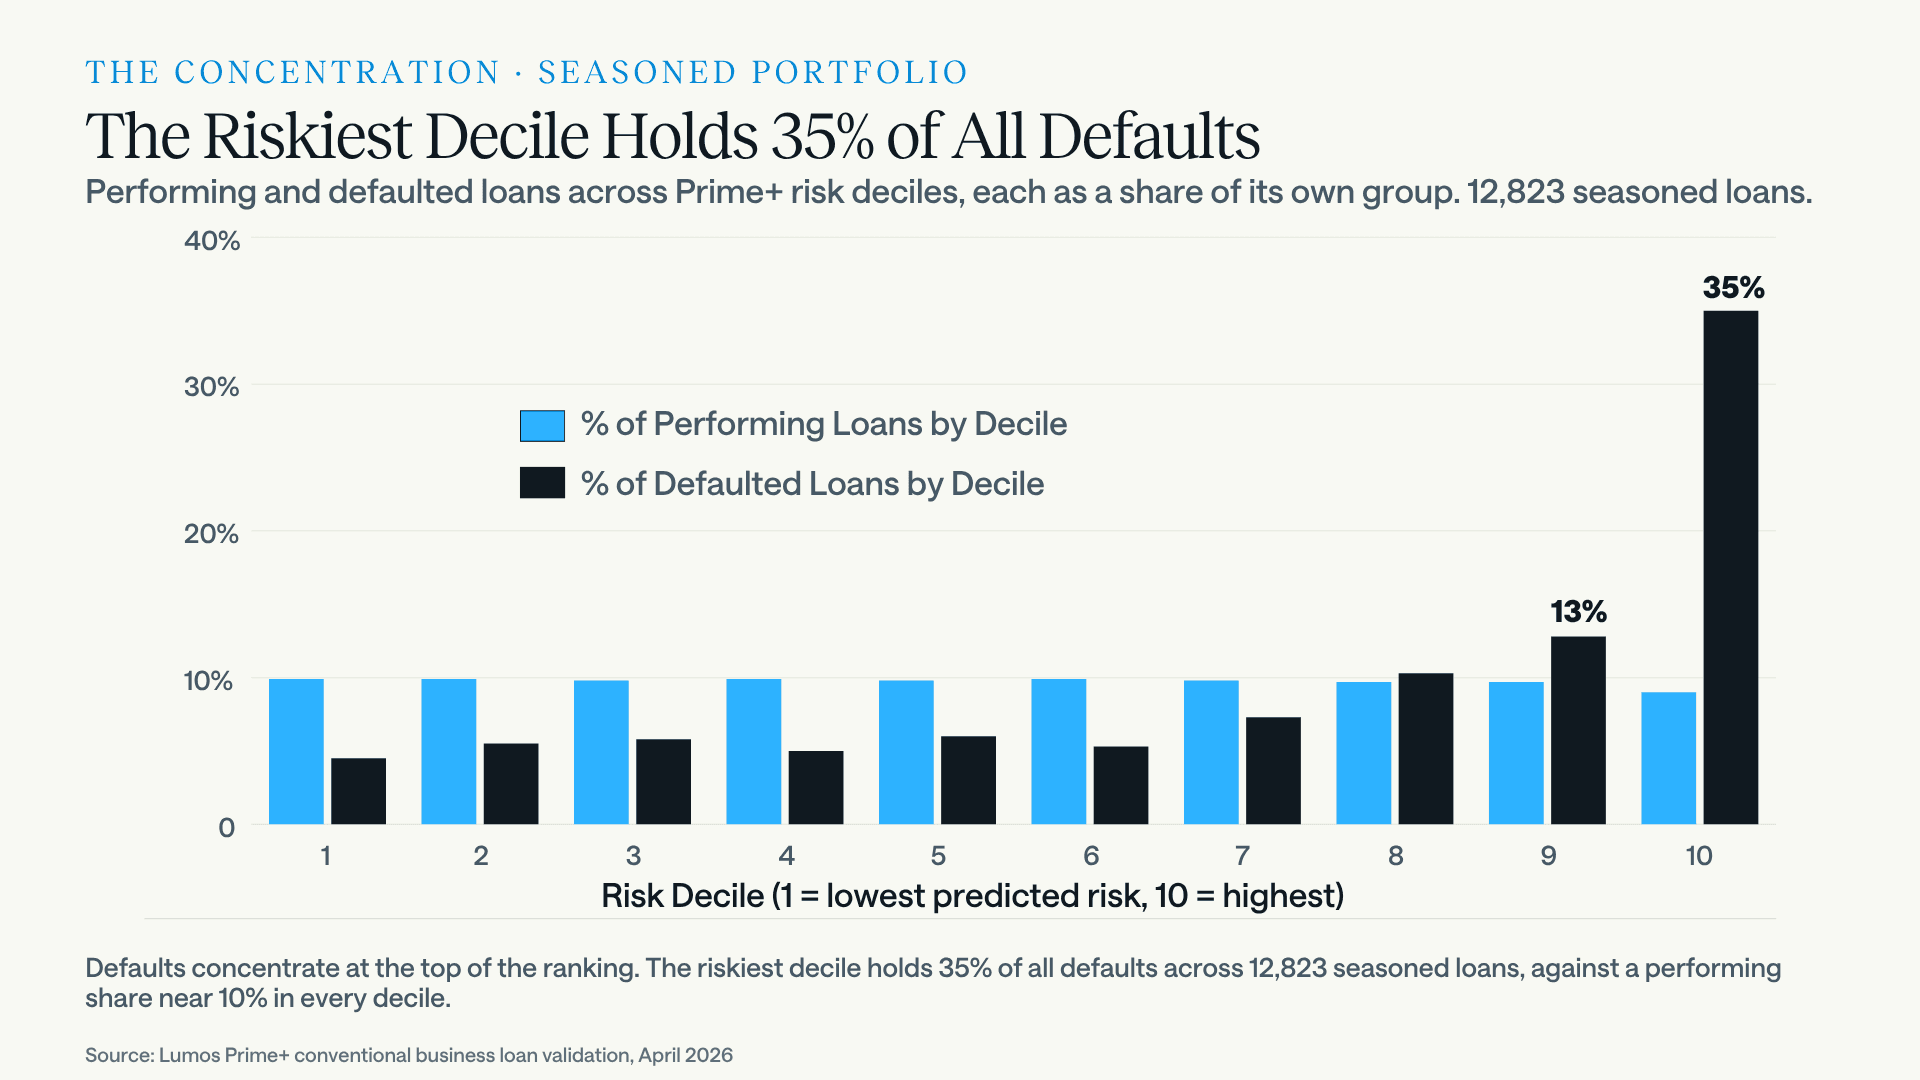
The practical version of that concentration is a trade between volume and losses. Declining the riskiest 20% of applications, following the Lumos Prime+ ranking, would have avoided about 50% of historical defaults in this seasoned data set.
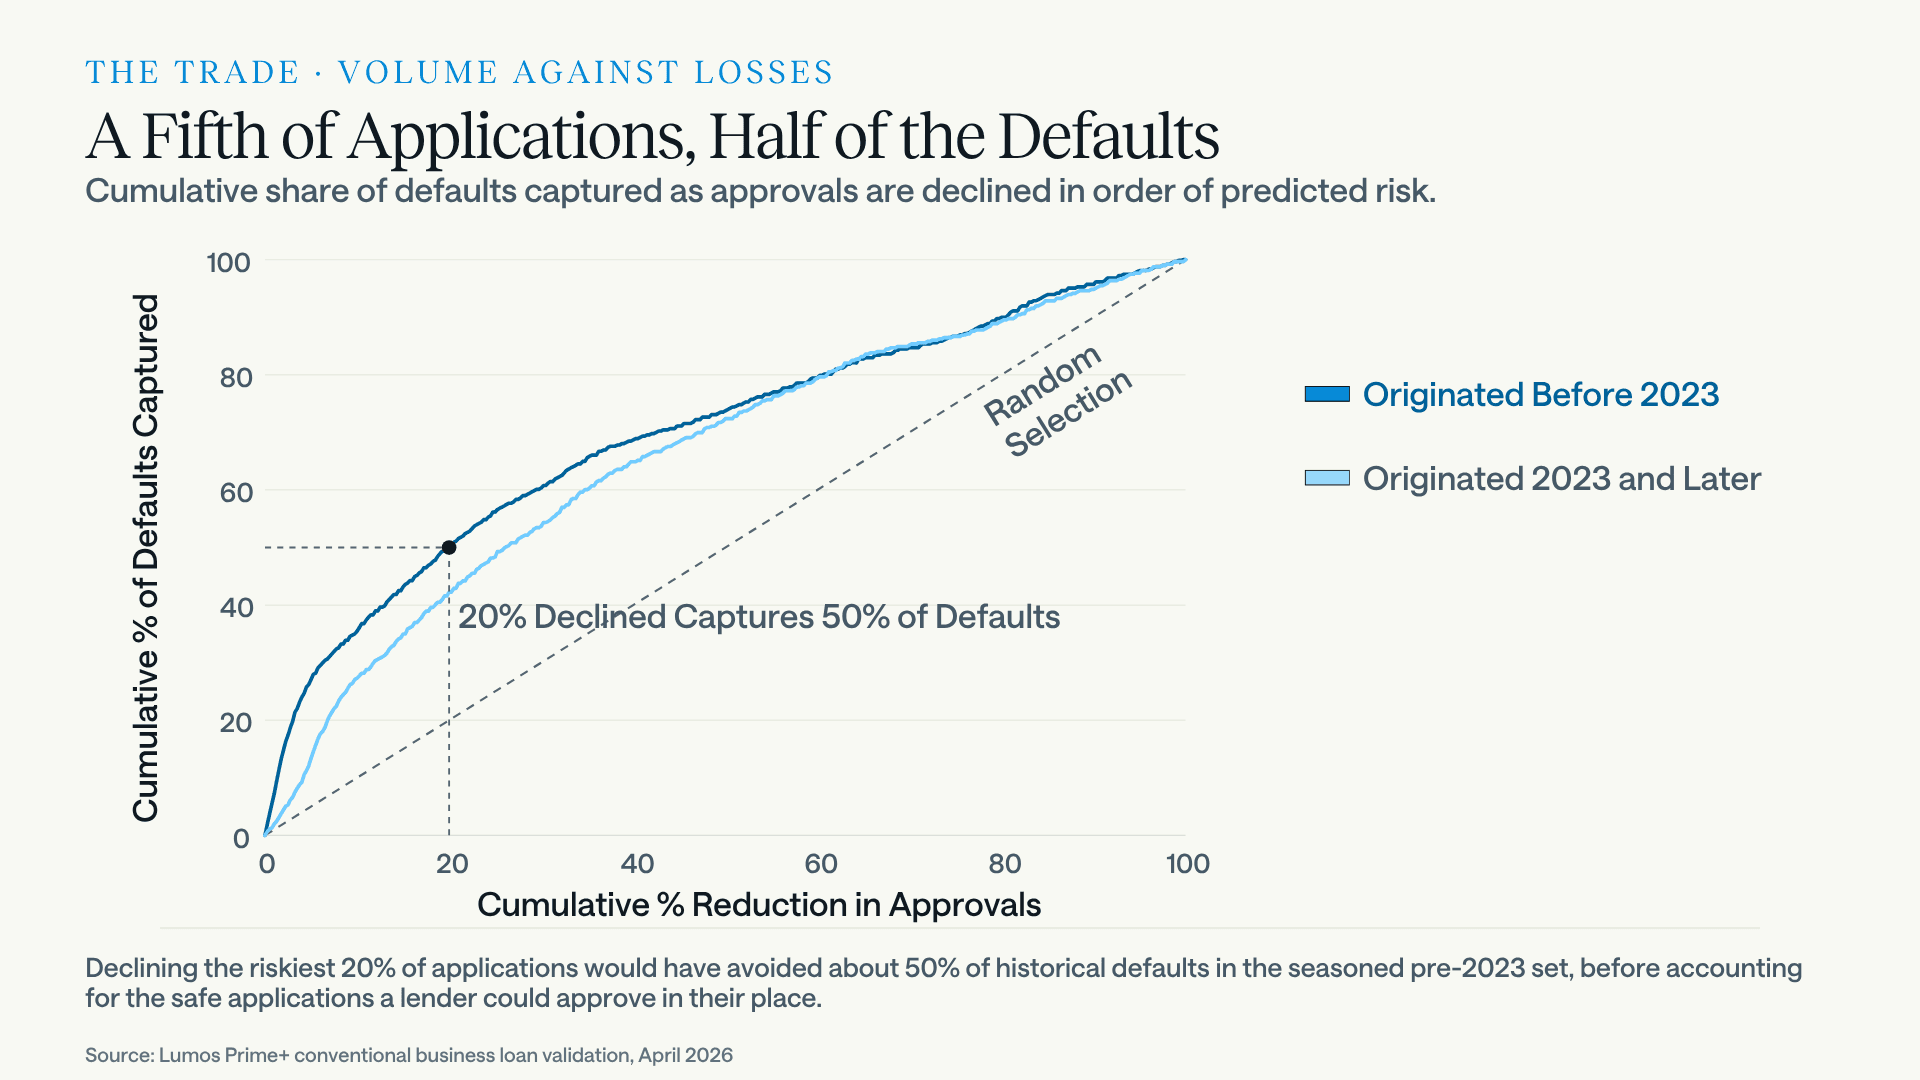
Three boundaries belong on that figure. It is retrospective, calculated across loans whose outcomes are already known, and a prospective decline rule would not perform identically. It is drawn from pre-2023 originations, which are the only ones seasoned enough to support the calculation. And the 20% reduction in approvals is a gross figure that does not net out the previously declined applications Prime+ scored as safe, which a lender could have approved in their place. Whether that trade is worth making depends on a lender's pricing, cost of funds, and growth targets, which is a judgment no model makes.
The declined applications run the other way, and they are the half of this trade that gets overlooked. Lumos Prime+ scored 54,538 of them. They generally drew the highest predicted PDs within each lender's book, but they did not draw uniformly high ones: in every portfolio, part of the declined population scored below that lender's own approved median. A ranking that identifies the riskiest approvals identifies the safest declines in the same pass.
That points at a different use of the model than trimming a book. A lender working from the ranking can decline its riskiest approvals and review its lowest-scoring declines together, which changes what it books rather than simply how much. Whether total volume then holds flat, falls, or rises depends on how many declines clear that lender's threshold, and the pool is not small: these five lenders declined 54,538 applications against the 34,372 they approved. The 20% figure above measures only the first move.
One boundary is firm and worth stating plainly. A declined application was never booked, so it has no outcome, and nothing in this data establishes that a low-scoring decline would have performed.
The agreement result is the reason to look anyway. Across the declined population as a whole, Lumos Prime+ reached the same conclusion the underwriters reached, which indicates that most of what underwriting acts on is present in the data the model sees. A decline the model scores as low risk is an exception to that pattern, and an exception is worth examining when the pattern is otherwise strong. The competing reading is that the exception is the underwriter seeing something the file does not carry, which is exactly the case that would not show up in a backtest of approved loans. Both readings recommend the same next step, which is to look at those files rather than to assume in either direction.
What the ranking produces is a list worth re-examining, not a conclusion about loans that were never made. Settling it means approving some of them and waiting.
The broader argument about volume and loss moving independently is developed separately in The Growth vs. Risk Myth.
Defaults do not distribute themselves evenly, and a portfolio's worst tenth is not a tenth of its problem.
Rank Ordering by Origination Year
The standard measure of ranking quality is the area under the receiver operating characteristic curve, or AUC, which describes how reliably a model ranks a defaulted loan above a performing one. An AUC of 0.5 is a coin flip and 1.0 is perfect separation.
Reported by origination year, the results were uneven, and the pattern in that unevenness carries more information than the average does.
Origination year | Lumos Prime+ AUC | Cohort |
|---|---|---|
2019 | 0.626 | Seasoned |
2020 | 0.765 | Seasoned |
2021 | 0.720 | Seasoned |
2022 | 0.752 | Seasoned |
2023 | 0.619 | Unseasoned |
2024 | 0.691 | Unseasoned |
2025 | 0.674 | Unseasoned |
Pre-2023 combined | ≈0.70 | Seasoned |
2023 and later combined | 0.656 | Unseasoned |
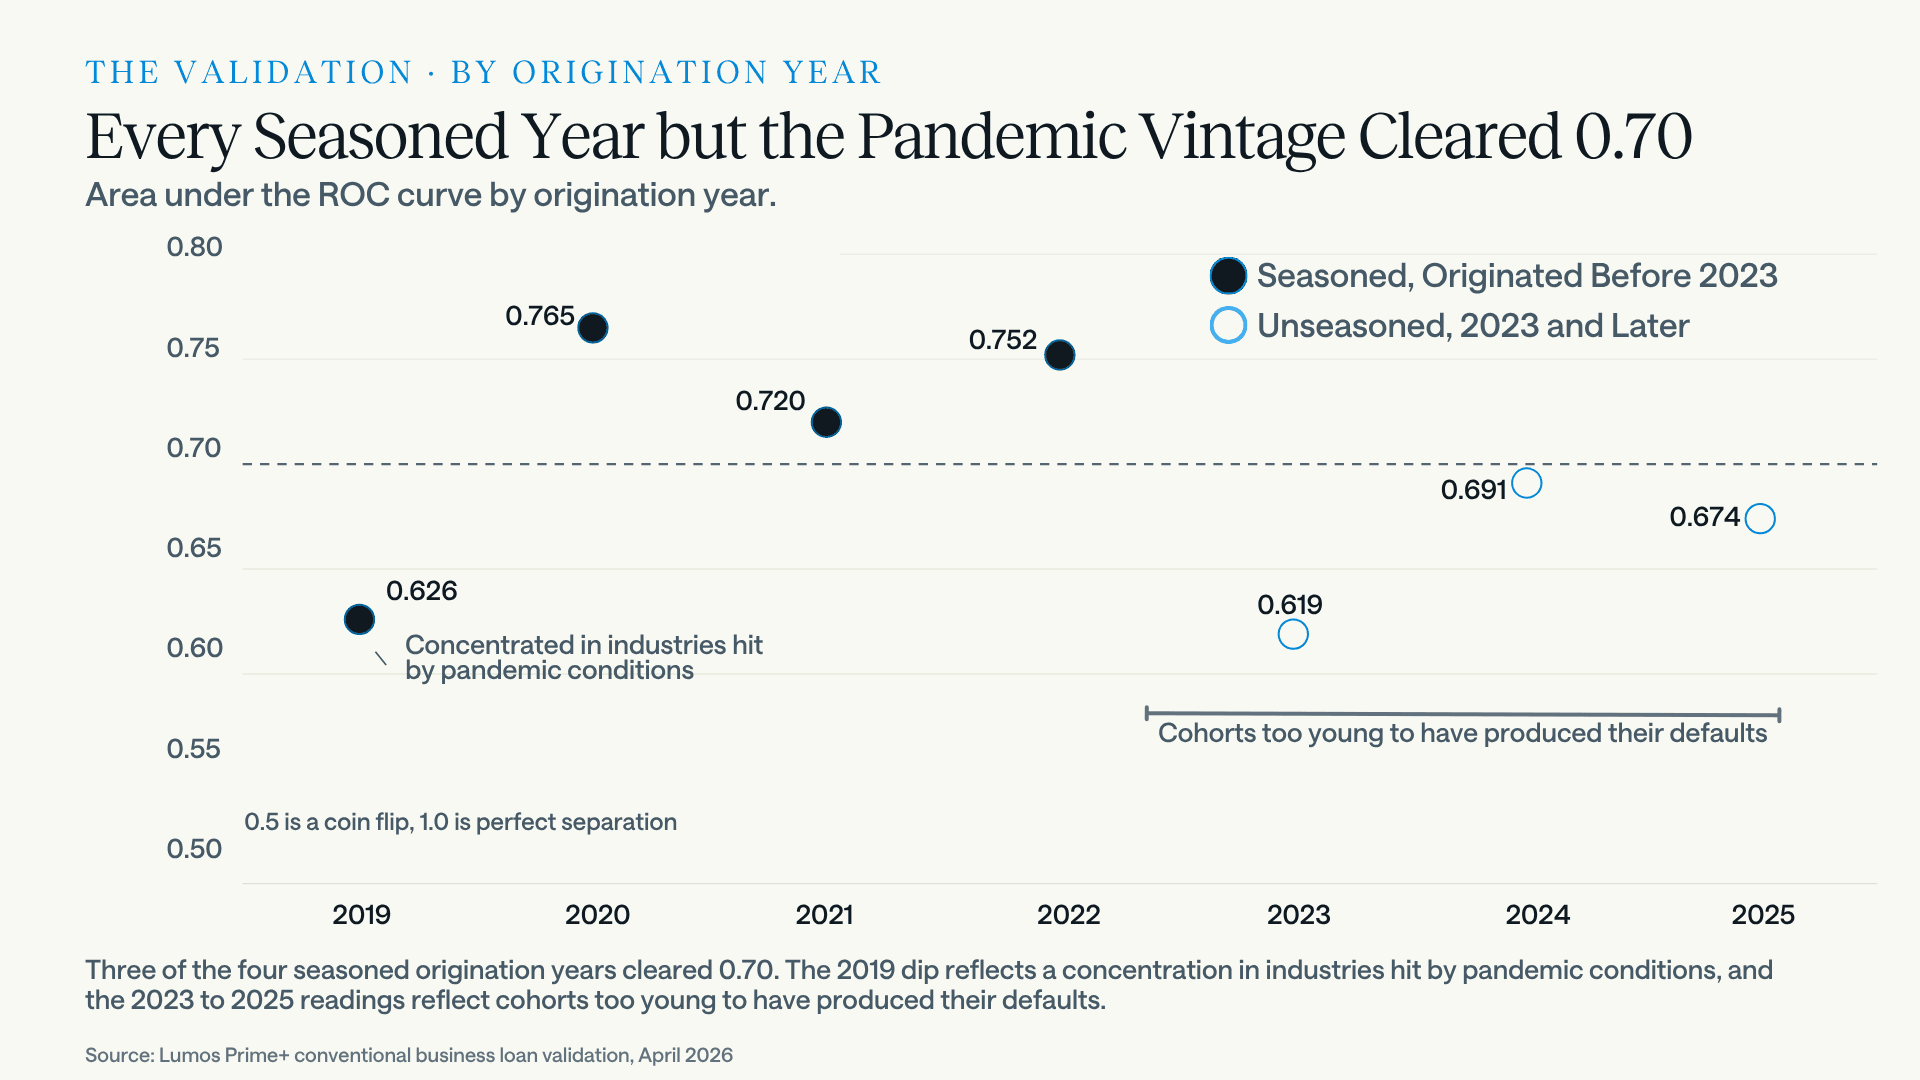
For loans originated before 2023, Lumos Prime+ reached an AUC of approximately 0.70, and above 0.70 in every year of that cohort except 2019. Whether 0.70 is a strong figure is better answered in operational terms than against a benchmark, and the decile ranking above is the answer: that figure is what put 35% of all defaults into the riskiest tenth of the book, three and a half times its share. It was earned under conditions that hold the number down rather than flatter it: out-of-time vintages, a book only partly seasoned, an event rate near 2.3%, and a scored population the lenders' own underwriting had already filtered. That last constraint matters most. AUC can only be computed where outcomes are known, so it was measured on approved loans, a population whose highest-risk applicants were removed before origination. Ranking within a book that has already been screened is harder than ranking across everything that walked in the door. Results produced without those constraints are not comparable to this one.
The 2019 exception, at 0.626, came from a concentration in industries that pandemic conditions hit disproportionately early in those loans' lives. Those industries defaulted at rates well above the 2019 cohort's other sectors, and nothing in a 2019 loan file marked which borrowers would be exposed to a shock that had not yet happened.
Two forces then pulled on that cohort in opposite directions. The shock produced defaults among borrowers that had looked sound at origination. Federal relief and widespread loan modification, including the Paycheck Protection Program, suppressed defaults among borrowers the model had scored as weak. That effect was large enough to register nationally, where the surge in business bankruptcies that the 2020 contraction would ordinarily have produced did not materialize. Rank ordering is measured against recorded outcomes, so both dynamics loosened the link between borrower quality and observed performance, which is the link AUC exists to measure. The pattern points to distortion in the recorded outcomes rather than a breakdown in ranking.
It is also confined to one vintage. The same model, applied to all seven without cohort-specific tuning, cleared 0.70 on three of the four seasoned years.
For originations in 2023 and later, AUC was 0.656. Those cohorts are young, and the section below explains why that number should be read as provisional.
Predicted Default Risk Is Rising
Average Lumos Prime+ predicted PD on new originations stayed below 0.5% for the 2019 through 2021 vintages. For 2024 and 2025 originations it exceeded 1.5%, more than triple the earlier level. On the 27 conventional business loans in this sample originated in 2026, average predicted PD exceeded 5%.
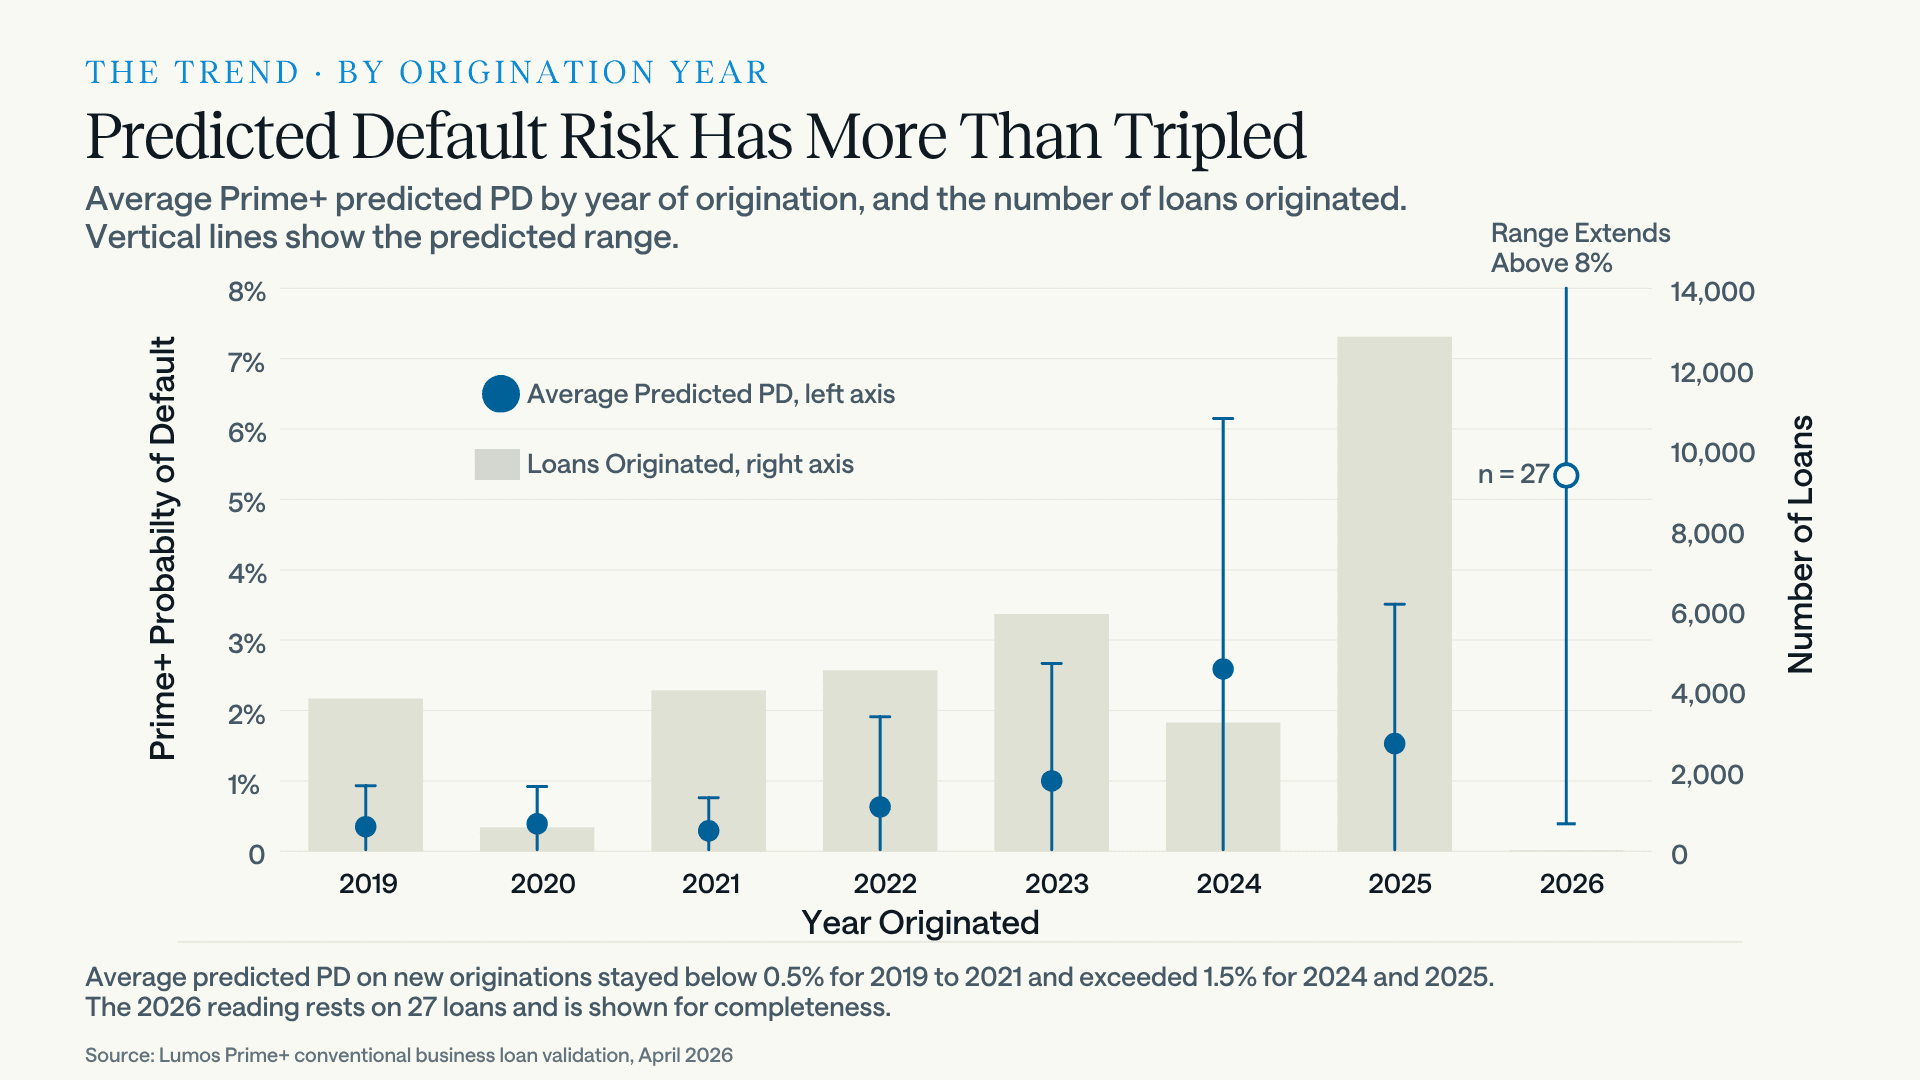
That last figure rests on 27 loans. It is reported for completeness rather than as a finding, and a sample that size cannot settle what 2026 conditions look like.
The distinction the rest of the trend depends on is between predicted and realized. The rising numbers above are model outputs on newly originated loans, not observed defaults. Realized cumulative default rates in this sample moved differently: 3.27% for 2019 originations easing to 2.93% for 2022, then 1.69% for 2023 rising to 1.99% for 2025.
Those two series appear to contradict each other, and the strongest alternative explanation deserves a direct answer. If predicted risk is climbing while observed defaults on recent vintages are lower, one possibility is that the model has drifted upward and is now over-predicting on new originations. The competing explanation is seasoning: the 2023 through 2025 cohorts have not lived long enough to produce their defaults, so their cumulative rates are necessarily depressed and will rise as the loans age.
The seasoning explanation fits the rest of the evidence better. AUC on those same young cohorts is also below the seasoned cohorts' level, which is what a shortage of realized outcomes produces rather than what genuine model decay looks like. Measurement pulls the same way, since healthy borrowers who refinance away leave a portfolio without defaulting and reshape the denominator these rates are calculated on, a point developed in the analysis of SBA 7(a) prepayment speeds. Seasoning is the better reading of the evidence, though it is not yet a settled one, and it makes a specific prediction: as the 2023 through 2025 cohorts mature, both their realized default rates and the measured AUC on them should rise. If neither does, the drift explanation gains ground. The 2023 cohort crosses the three-year seasoning threshold during 2026 and is the first that can settle the question.
The recent cohorts are not safer. They are younger.
Scope of the Findings
Five lenders is a small number of institutions, even at 88,917 applications, so the absolute default levels reported here should not be read as representative of conventional small business lending generally. The rank ordering results are a different matter, because they compare loans within each lender's own portfolio and do not depend on the five being a representative sample.
There is a further point in the five-lender design that reads as a limitation and works as the opposite. Default is not an observed fact like death. It is a reporting classification, and whether a struggling borrower carries it depends on where the lender sets its delinquency threshold, how quickly it charges off, how readily it modifies or restructures, and the regulatory treatment in force at the time. Two identical borrowers at two lenders can produce different recorded outcomes, and a borrower who falls behind and later catches up may be recorded as a default under one lender's definition and never under another's. A model fitted inside one institution learns that institution's conventions along with its credit risk, and a model scored inside one institution is graded against them. Lumos Prime+ was fitted inside none of them, and the loans it learned from were labeled under several different conventions rather than one. Ranking consistently across five sets of conventions is evidence that what Lumos Prime+ measures is the borrower rather than the bookkeeping. It is also the general case of what 2019 showed acutely, when relief and forbearance rewrote those conventions across the whole market at once.
The findings concern PD only. Loss given default and expected loss, which Lumos Prime+ also predicts, were not tested in this study.
The 50% capture figure is retrospective, drawn from pre-2023 loans, and gross of the volume a lender could recapture from safe declines.
The trend in predicted default risk is a model output. It is a forecast of credit deterioration, not a measurement of it, and the cohorts that will confirm or contradict it are still seasoning.
One scope limit sits outside the data entirely. Whether conventional small business credit is diverging from large corporate credit cannot be settled from public bank reporting, because the Call Report collects loan size for volume and never for performance, and the published series stratify by the size of the bank rather than the size of the borrower. Our analysis of what those aggregates can and cannot measure sets out why, and what loan-level data shows in their place.
At Lumos, we do not forecast the macro economy, and none of the above should be read as a call on where conditions go next. Findings on the SBA side, where the 7(a) portfolio's twelve month default rate reached 4.8% in March 2026, are examined separately in SBA 7(a) Default Rates Hit 4.8%. That is a different population operating under a different mandate, and the two sets of figures should not be blended, though they point the same direction.
Lenders weighing bureau scores, internal scorecards, and lifetime models against one another will find the evaluation criteria set out in our guide to building or buying a small business credit risk model. Those criteria apply to Lumos Prime+ as much as to anything else.
What the analysis does support is narrower than a marketing claim and more useful than one. Across five independent portfolios, Lumos Prime+ ranked defaulted loans above performing ones at an AUC near 0.70 on seasoned vintages, concentrated 35% of all defaults into a single decile, and reproduced underwriters' own decline decisions without being shown them. Those three results were produced on lenders' own books rather than on a development sample, and they are what everything above rests on.
Every number here is a prediction with a date attached, and the cohorts that would confirm or break it are already on the books.
The designed version of this report, with the full figures formatted for circulation to a credit committee, is available as a PDF. Lumos will also retro-score a lender's own historical originations and declined applications, which produces the equivalent of the analysis above on that lender's portfolio rather than on these five. Request a portfolio retro-score.
Frequently Asked Questions
What is the default rate on conventional small business loans?
In the Lumos Prime+ validation, a five-lender sample of 34,372 approved conventional business loans, 792 had defaulted at the time of analysis, a rate near 2.3%. Measured by origination year, cumulative default rates ran 3.27% for 2019 originations and 2.93% for 2022, with the 2023 through 2025 vintages reading lower at 1.69% to 1.99% because those loans have not finished seasoning.
Are conventional business loan defaults rising?
Predicted default risk on new originations is rising sharply. Average Lumos Prime+ predicted PD stayed below 0.5% for 2019 through 2021 originations and exceeded 1.5% for 2024 and 2025. Realized default rates on those recent vintages remain lower, which is consistent with loans too young to have defaulted yet rather than with improving credit.
What is a seasoned loan?
A seasoned loan is one old enough to have passed through most of the period in which defaults typically occur. This analysis used three years as the threshold, splitting performing loans into those under three years old and those three years or older.
How accurate is Lumos Prime+ on conventional business loans?
Measured by area under the curve, which describes how reliably a model ranks a defaulted loan above a performing one, Lumos Prime+ reached approximately 0.70 on conventional business loans originated before 2023, and above 0.70 in every year of that cohort except 2019. For 2023 and later originations the figure was 0.656, which reflects cohorts too young to have produced their defaults. In operational terms, that level of ranking accuracy placed 35% of all defaults in the riskiest tenth of the seasoned portfolio, against a 10% share of the loans.
Does Lumos Prime+ agree with human underwriters?
Within each of the five lender portfolios, the applications those lenders declined generally received the highest predicted default probabilities of any group. The model reached that ranking without access to the credit decisions, which indicates agreement with underwriter judgment rather than a substitute for it.
How much default reduction is possible without cutting volume?
In this seasoned data set, the riskiest decile by Lumos Prime+ ranking contained 35% of all defaults and the next riskiest a further 13%. Declining the riskiest 20% of applications would have avoided roughly 50% of historical defaults, before accounting for the safe applications a lender could approve in their place.
Does using a credit risk model mean approving fewer loans?
Not necessarily. Lumos Prime+ scored 54,538 applications the five lenders had declined, and in every portfolio a portion of the declined population scored below that lender's own approved median. Declining the riskiest approvals and reviewing the lowest-scoring declines are two halves of one ranking, which allows a lender to change what it books rather than simply how much, with a declined pool larger than the approved book to draw from. Declined applications were never booked and have no observed outcome, so they represent candidates for review rather than proven credits.
Is this analysis about SBA loans?
No. Every loan in this study is a conventional business loan held without a government guarantee. SBA 7(a) performance is a separate population analyzed separately.
Book a 30-minute demo. No pressure, no sales pitch. Just a straightforward conversation about whether Lumos is right for you.
What To Expect:
Quick platform overview
Live demo with real loan examples
Discussion of your specific needs
Clear next steps
"The data and insights provided by Lumos have been instrumental in driving numerous policy changes within our organization."
VP, Senior Product Manager, US Bank

" height="29.26525980811059px" id="Eth71R0cp" transform="translate(50.52 7.877)" width="128.4356838868068px"/><path d="M 11.504 26.662 C 13.336 26.98 15.177 27.241 17.025 27.445 C 17.285 29.224 17.589 31.249 17.922 33.01 C 19.147 32.283 21.153 30.675 22.427 29.793 C 23.831 30.749 25.613 32.22 26.99 33.03 C 25.815 36.077 24.734 39.17 23.558 42.217 C 23.29 42.912 22.993 43.872 22.596 44.483 C 21.955 44.554 21.761 43.465 21.609 42.971 C 20.391 40.097 18.964 36.046 17.872 33.065 C 16.793 33.66 7.128 38.055 6.752 38.016 C 6.687 38.009 6.584 37.851 6.538 37.796 C 6.428 37.314 9.351 31.438 9.748 30.419 C 10.07 29.592 11.059 27.547 11.504 26.662 Z M 33.315 17.665 C 33.811 17.67 44.337 21.602 44.765 21.893 C 44.829 22.154 44.823 22.057 44.743 22.33 C 44.2 22.746 41.332 23.727 40.478 24.044 L 33.378 26.673 C 33.931 27.703 34.585 29.232 35.077 30.314 L 37.921 36.591 C 38.139 36.993 38.577 37.669 38.215 38.059 C 37.576 38.025 28.285 33.71 27.005 33.081 C 27.245 31.226 27.527 29.375 27.852 27.532 C 29.68 27.191 31.452 27.024 33.361 26.642 C 32.387 25.285 31.08 23.402 30.028 22.145 C 31.145 20.668 32.241 19.174 33.315 17.665 Z M 11.47 17.635 C 12.542 19.071 13.786 20.686 14.782 22.158 C 13.751 23.535 12.423 25.259 11.471 26.662 C 7.932 25.41 3.445 23.785 0 22.375 L 0 21.889 C 0.606 21.563 4.34 20.21 5.18 19.923 C 6.787 19.373 10.005 17.985 11.47 17.635 Z M 38.174 6.263 C 38.651 6.647 36.872 9.988 36.559 10.642 C 35.557 12.85 34.425 15.506 33.354 17.637 C 31.433 17.286 29.758 17.057 27.819 16.83 C 27.504 14.962 27.219 13.088 26.965 11.21 C 28.001 10.653 37.733 6.247 38.174 6.263 Z M 11.501 17.628 C 11.491 17.63 11.481 17.633 11.47 17.635 C 11.467 17.63 11.463 17.625 11.459 17.62 C 11.47 17.617 11.482 17.615 11.493 17.613 C 11.496 17.618 11.498 17.623 11.501 17.628 Z M 6.584 6.275 C 7.178 6.118 16.533 10.566 17.901 11.193 C 17.626 12.874 17.196 15.105 17.02 16.753 C 15.137 17.022 13.363 17.27 11.493 17.613 C 10.01 14.74 8.822 11.568 7.374 8.666 C 7.162 8.243 6.391 6.664 6.584 6.275 Z M 25.57 7.432 C 25.913 8.348 26.716 10.341 26.965 11.21 C 26.335 11.545 23.197 13.924 22.45 14.47 C 20.941 13.448 19.381 12.27 17.901 11.193 C 18.006 10.669 18.713 8.998 18.925 8.369 C 19.829 5.694 21.248 2.668 22.023 0 L 22.788 0 Z" fill="rgb(28, 26, 26)" height="44.486082377664px" id="u84SiQ2Nx" transform="translate(0 0.255)" width="44.80873390361835px"/></svg>)