
Executive Summary
Industry concentration limits are usually set against a sector default rate. This analysis provides those rates for nineteen NAICS sectors and finds three things that complicate how they should be used.
The rates come from SBA 7(a) performance history rather than from survey or aggregate data. That record is used here because it carries thirty years of loan-level outcomes with term, sector, lender, and result attached to each loan, a linkage that does not exist in public bank data. What it is not is a cross-section of all business credit, and the FAQ below says where that distinction matters.
Every sector deteriorated. Between 2019 and 2025, all nineteen sectors large enough to measure showed higher default rates and lower prepayment rates. There were no exceptions, which means no industry mix avoided the direction of travel.
Severity varied enormously. Default rates in 2025 range from 2.34% in Health Care to 6.69% in Transportation and Warehousing, and the decline in prepayment ranges from 0.4 points to 4.3. Industry mix therefore governs how hard a book was hit, not whether it was hit at all.
The third finding matters most for how these numbers are used. A sector default rate is a blend of two very different books. Within the same industry, loans written on terms of twenty-five years or longer default at a fraction of the sector's full-book rate, a small one in most, and that holds in all sixteen sectors where both can be measured. The margin is wide in most and narrow in Agriculture, where six defaults among 256 long-term loans separate 2.54% from 3.05%. Transportation defaults at 6.69% across its full book and 1.08% on its long-term loans. A concentration limit set on sector alone is set on the weaker of the two variables a concentration limit can be set on.
The Benchmark: 19 Sectors, 2019 Against 2025
Annual default rate is an exposure-adjusted annual rate: defaults are measured against loan-months at risk and annualized, so a loan booked in December is not treated as exposed for a full year. Prepayment is constructed the same way. Both are loan-weighted, meaning each loan counts once regardless of balance, and both are on a calendar basis. This runs somewhat above a simple defaults-over-loans share, which is why a figure drawn from another source may not match. Our guide to how Lumos measures default and prepayment sets out each construction and reconciles them. Sectors are two-digit NAICS groupings, restricted to those carrying 200 or more loans in both comparison years.
Sector | Loans 2025 | Default 2019 | Default 2025 | Prepay 2019 | Prepay 2025 | Prepay change | Avg term (mths) |
|---|---|---|---|---|---|---|---|
Transportation and warehousing | 16,677 | 3.73% | 6.69% | 11.62% | 9.37% | −2.26 | 121 |
Information | 3,077 | 3.19% | 5.51% | 10.89% | 8.92% | −1.97 | 134 |
Utilities | 389 | 1.36% | 5.02% | 11.23% | 10.53% | −0.70 | 129 |
Wholesale trade | 13,586 | 3.21% | 4.51% | 12.23% | 9.67% | −2.56 | 145 |
Arts, entertainment and recreation | 11,237 | 3.65% | 4.43% | 10.69% | 8.80% | −1.89 | 143 |
Mining, quarrying, oil and gas | 513 | 3.42% | 4.17% | 15.22% | 13.75% | −1.48 | 135 |
Retail trade | 41,932 | 2.73% | 4.13% | 11.87% | 9.66% | −2.20 | 163 |
Accommodation and food services | 42,614 | 3.16% | 4.04% | 11.81% | 9.60% | −2.21 | 172 |
Educational services | 5,037 | 2.38% | 3.89% | 11.02% | 9.00% | −2.02 | 149 |
Construction | 38,476 | 2.67% | 3.81% | 11.70% | 9.35% | −2.36 | 130 |
Manufacturing | 21,118 | 2.87% | 3.81% | 11.78% | 9.69% | −2.09 | 147 |
Professional and technical services | 30,434 | 2.19% | 3.63% | 11.97% | 9.28% | −2.69 | 143 |
Real estate, rental and leasing | 7,720 | 1.99% | 3.60% | 13.60% | 9.33% | −4.26 | 178 |
Administrative and support | 17,641 | 2.51% | 3.51% | 10.87% | 9.11% | −1.76 | 128 |
Other services | 32,603 | 2.37% | 3.35% | 10.87% | 8.67% | −2.19 | 162 |
Agriculture, forestry, fishing | 3,671 | 2.44% | 3.05% | 12.74% | 11.74% | −1.00 | 159 |
Finance and insurance | 5,960 | 1.52% | 2.66% | 12.63% | 12.22% | −0.40 | 148 |
Health care and social assistance | 32,699 | 1.82% | 2.34% | 12.03% | 8.53% | −3.50 | 180 |
Management of companies | 229 | 0.00% | 0.50% | 13.80% | 10.37% | −3.43 | 198 |
Rates are calculated from unrounded figures and displayed to two decimals, so the change column can differ by 0.01 from subtracting the two printed cells.
Utilities, Mining, and Management of Companies carry fewer than 600 loans each, so year-over-year movements in those rows are noisy and should not be read as trends. Management of Companies recorded no defaults in 2019, so no ratio is computable for it. Set those three aside and the rest still carry more than the table shows on its face.
Every Sector Moved the Same Way, by Very Different Amounts
Nineteen industries with different customers, cost structures, collateral, and cycles all moved the same way on both measures at once. Whatever happened to this population was not sector-specific.
The comparison year matters, and less than it might. Measured against each sector's own 2015 to 2019 average rather than against 2019 alone, defaults are higher in eighteen of nineteen sectors and prepayment lower in fifteen. The exceptions on prepayment are Finance and Insurance, Utilities, Mining, and Management of Companies; on defaults it is Management of Companies. The result is weaker on that basis and it does not reverse.
The severity is another matter. Transportation and Warehousing deteriorated to nearly three times the rate of Health Care, so industry mix governed how hard a book was hit even though it protected no one from being hit.
Prepayment tells the same story with a different distribution. Real Estate lost 4.3 points of prepayment and Health Care 3.5, while Finance and Insurance lost 0.4 and Utilities 0.7. Since prepayment is how a healthy borrower exits, through sale, payoff, or refinancing, a large decline means borrowers who would once have left are staying. Rising defaults alongside falling prepayments is what a closing exit looks like.
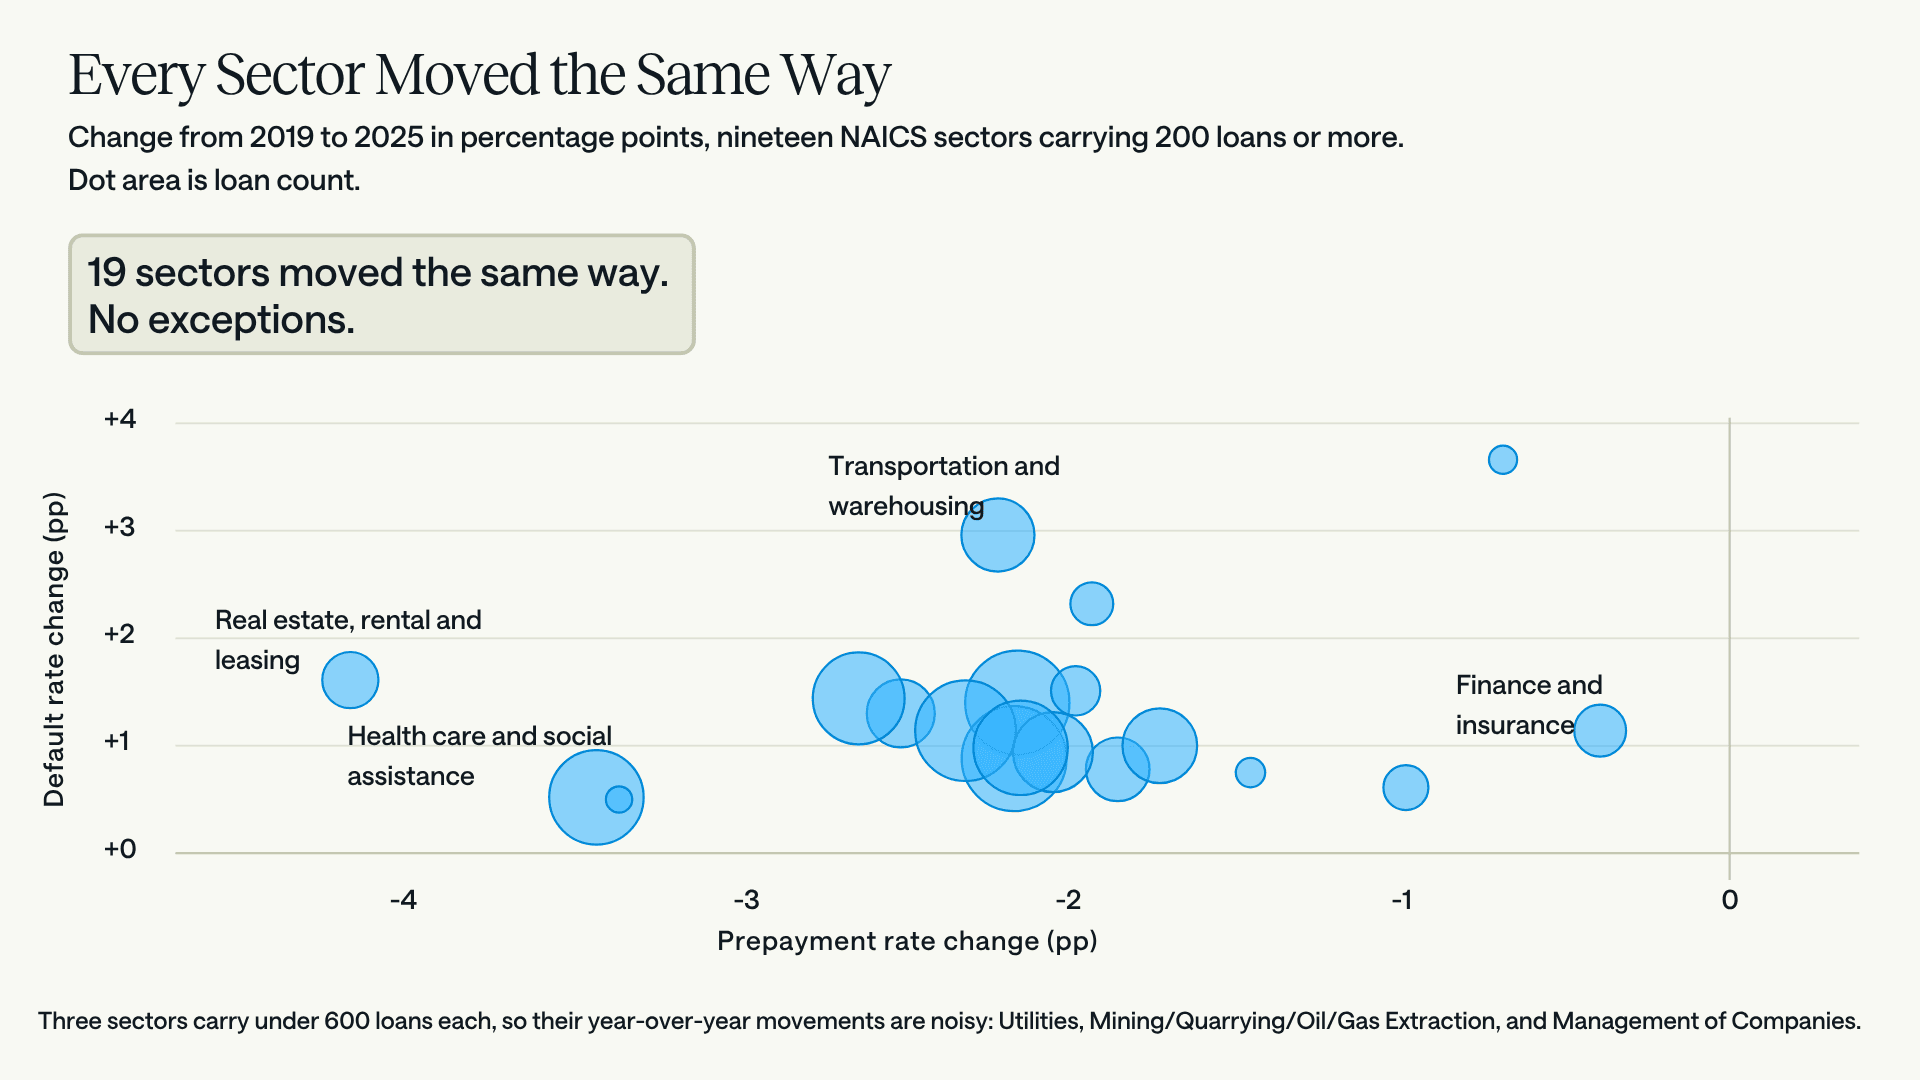
Every sector moved the same way. Between 2019 and 2025 all nineteen NAICS sectors carrying 200 or more loans recorded higher defaults and lower prepayments. Against 2015 to 2019 averages the counts are eighteen and fifteen. Dot size reflects loan count. Source: Lumos analysis of loan-level SBA 7(a) performance history.
Sectors that write longer paper generally saw the larger prepayment declines, though with nineteen sectors the pattern is a signal rather than a settled result. Term keeps surfacing in these numbers, and it carries more information than the industry label does.
Why a Sector Rate Hides Two Different Books
A sector default rate blends loans with very different structures, and the blend hides more than it reports.
Restricting each sector to loans written on terms of twenty-five years or longer, and comparing against that sector's full book on an identical measure, the long-term loans perform better in all sixteen sectors where both populations clear 200 loans. There are no exceptions.
Sector | Full book 2025 | 25-year book 2025 | Gap |
|---|---|---|---|
Transportation and warehousing | 6.69% | 1.08% | 5.61 |
Information | 5.51% | 0.00% | 5.51 |
Wholesale trade | 4.51% | 0.95% | 3.56 |
Retail trade | 4.13% | 0.92% | 3.21 |
Professional and technical services | 3.63% | 0.47% | 3.16 |
Construction | 3.81% | 0.76% | 3.05 |
Administrative and support | 3.51% | 0.60% | 2.91 |
Real estate, rental and leasing | 3.60% | 0.73% | 2.87 |
Accommodation and food services | 4.04% | 1.19% | 2.85 |
Arts, entertainment and recreation | 4.43% | 1.66% | 2.77 |
Manufacturing | 3.81% | 1.11% | 2.70 |
Other services | 3.35% | 0.70% | 2.65 |
Finance and insurance | 2.66% | 0.13% | 2.53 |
Educational services | 3.89% | 1.48% | 2.41 |
Health care and social assistance | 2.34% | 0.72% | 1.62 |
Agriculture, forestry, fishing | 3.05% | 2.54% | 0.51 |
Information recorded no defaults at all on its 231 long-term loans, which is a small enough population that the zero should be read as a low rate rather than a precise one. Mining, Utilities, Management of Companies, and Public Administration carry fewer than 200 long-term loans each and are not shown.
Portfolio-wide the same comparison gives 3.83% against 0.89%.
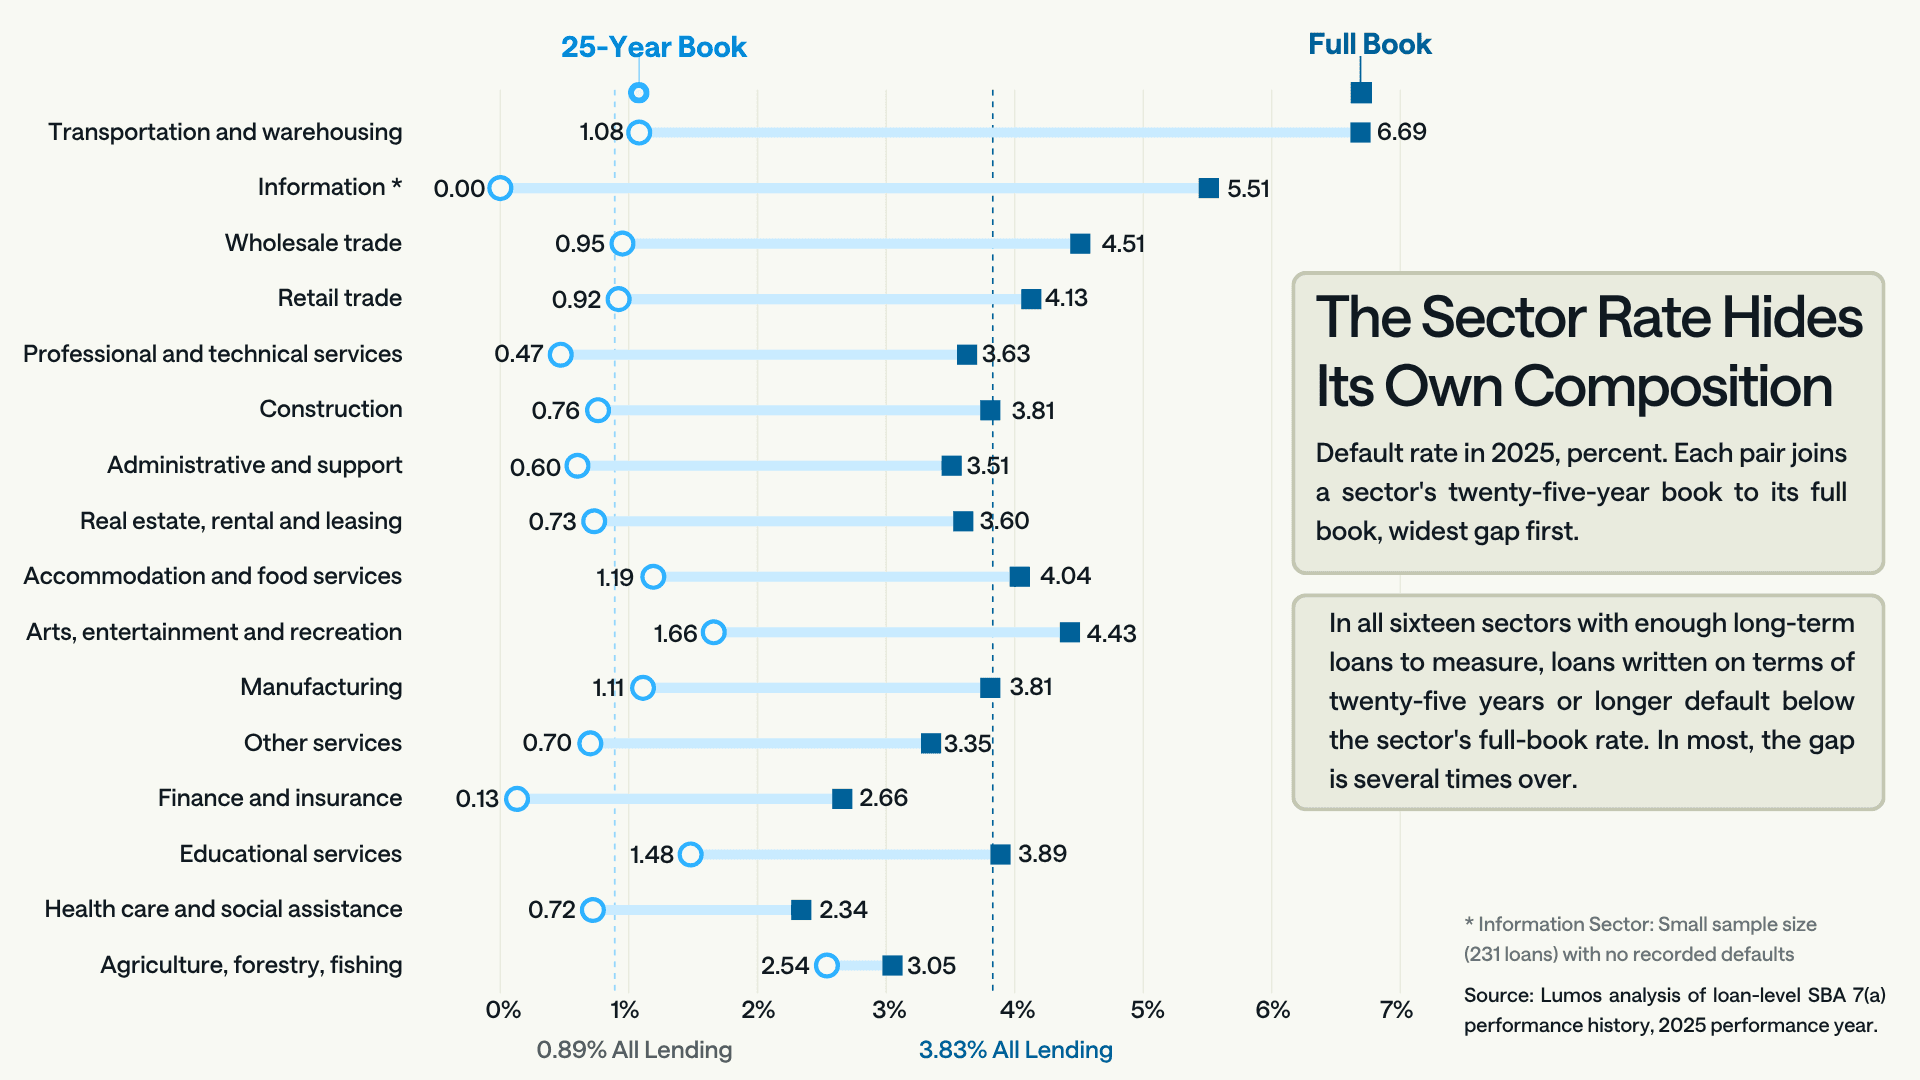
Default rates by sector, 2025 performance year. The long-term book is not made up of smaller, safer credits: those loans average about $1.31 million against $544,000 across the portfolio, so loan size does not explain the gap. Source: Lumos analysis of loan-level SBA 7(a) performance history.
A reader familiar with SBA lending will already have an explanation, and it is not that these are small, safe credits. Twenty-five year amortization generally signals a real estate purchase, which means a larger balance against an asset that holds its value. The loan sizes bear that out. Loans in the twenty-five year book average roughly $1.31 million on a loan-weighted basis against $544,000 across the whole portfolio, so the better-performing population is the larger-balance one.
That raises the question of which variable is doing the work. Across sectors, loan size has no relationship with default rates once term is controlled for, while term itself has a strong one. Size travels with term in this portfolio without driving the outcome.
Two structural mechanisms separate long-term paper from the rest, payment arithmetic and collateral. Stretching the same balance over twenty-five years rather than ten cuts the monthly payment substantially, leaving more of the borrower's cash flow uncommitted and blunting the effect of any rate rise. Long amortization points to real estate, as above, while shorter terms fund equipment, working capital, and acquisition, where the asset depreciates faster than the debt amortizes and there is less to recover.
For a lender, this means the term composition of a sector exposure carries more information than the sector label. Two books with identical NAICS concentration and different term profiles are not carrying the same risk, and the published sector rate describes neither of them.
Sector Explains Less Than the Lender Does
The variation among lenders exceeds the variation among sectors, and it is not close. Across 199 SBA lenders, 2025 default rates ranged from zero to 14.86%, with 24 lenders above 7%. That spread is far wider than the gap between the best and worst industries in the table above, and portfolio size does not order it. Sector mix explains part of a book's performance. Lender-specific factors, credit box, and term composition explain more.
Concentration limits set on industry alone are therefore set on the weakest of the three variables at this level of aggregation, weaker than term structure and weaker than whatever separates one lender from another. The sector rate is a useful reference and a poor ceiling.
The difference between those two uses is worth drawing out, because it points at the better question. A sector rate used as a ceiling asks whether an industry is too risky to hold, and answers it with the variable that explains least. A sector rate used as a baseline asks how a book's own performance in an industry compares with the market's performance in that same industry. That holds industry constant and isolates the thing the dispersion above says actually moves outcomes, which is the lender.
One scope note. These are two-digit groupings and backward-looking rates on completed years. Finer industry definitions carry more information than broad ones, and a forward-looking estimate is a different object from a historical rate. Neither is measured here.
For why aggregate bank data cannot produce these numbers at all, see our analysis of what C&I aggregates can and cannot measure. Prepayment behavior across the portfolio, rather than by sector, is covered in our analysis of SBA 7(a) prepayment speeds, the current headline default reading in our analysis of SBA default rates, and the underlying method in our guide to small business credit risk. Lumos Portfolio Insights scores an existing book loan by loan against this population, and Prime+ does the same at origination.
Figures current as of the 2025 performance year, drawn from loan-level SBA 7(a) history through May 2026. Updated annually.
Frequently Asked Questions
What is a normal small business default rate by industry?
Across the SBA 7(a) portfolio in 2025, annual default rates ran from 2.34% in Health Care and Social Assistance to 6.69% in Transportation and Warehousing, with most sectors between 3% and 4.5%. Those are loan-weighted annual rates on a calendar basis, with each loan counting once regardless of balance. A rate is only comparable to another rate built the same way, so check the construction before setting one against a portfolio figure.
Which industries carry the highest small business default rates?
Transportation and Warehousing at 6.69%, Information at 5.51%, and Utilities at 5.02% lead the 2025 table, though Utilities carries under 400 loans and moves sharply year to year. Among sectors with meaningful volume, Transportation, Wholesale Trade, and Retail Trade sit at the top. Health Care and Social Assistance and Finance and Insurance sit at the bottom.
Why do long-term loans default less than short-term loans?
Two reasons. The payment is smaller for the same balance, so debt service takes less of the borrower's cash flow and a rate rise moves it by less. And long amortization on SBA credit generally signals real estate collateral, while shorter terms fund equipment, working capital, and acquisitions, where the asset depreciates faster than the debt amortizes. The effect is large: 0.89% against 3.83% portfolio-wide in 2025, holding in all sixteen sectors with enough long-term volume to measure.
Can a conventional book be benchmarked against these numbers?
With care, and the direction of the adjustment depends on the book. These borrowers are defined by not having qualified for conventional credit on reasonable terms, so a large commercial portfolio serving borrowers with capital markets access should be expected to sit lower. A community or regional bank's conventional small business book may sit in much the same place, or higher, since it often serves the same borrowers a step earlier. What transfers most reliably is shape: which sectors move together, how much term structure separates outcomes, and the direction of travel between 2019 and 2025.
Did any industry avoid the deterioration?
No. All nineteen sectors carrying 200 or more loans in both years show higher defaults and lower prepayments in 2025 than in 2019. What varied was severity, from a 0.5 point rise in Management of Companies to 3.7 points in Utilities, or 3.0 points in Transportation and Warehousing among sectors with meaningful volume.
How often is this benchmark updated?
Annually, following the close of each performance year. The figures here cover calendar 2025, drawn from loan-level history through May 2026.
Sources and Methods
Figure | Source and measure |
|---|---|
Sector default rates, loan counts, average term, and loan size | Lumos 7(a) performance history, sector cut; exposure-adjusted annual rate, calendar basis |
Sector prepayment rates | Lumos 7(a) performance history, sector cut; exposure-adjusted annual rate, loan-weighted, calendar basis. Reconciles to portfolio prepayment measured by original term within about 0.4 points in both comparison years, the residual reflecting different populations and an annualized rate here against a mean of monthly rates there |
25-year book by sector | Same source, restricted to loans of twenty-five years and longer; the exposure-adjusted annual rate on both sides, so the comparison is built the same way throughout |
Lender range and dispersion | Lumos SBA lender panel, 199 lenders, conditional annual rates |
Conventions. All rates are loan-weighted and calendar-basis. Sector names follow the labels used in the exhibits, which omit the serial comma in three compound titles; the text otherwise uses it throughout. The 200-loan minimum is applied to both comparison years. The competing-risks result holds 19 of 19 on a calendar basis and 17 of 19 on an SBA fiscal-year basis; the calendar figure is reported because every other measure here is calendar-derived.
Book a 30-minute demo. No pressure, no sales pitch. Just a straightforward conversation about whether Lumos is right for you.
What To Expect:
Quick platform overview
Live demo with real loan examples
Discussion of your specific needs
Clear next steps
"The data and insights provided by Lumos have been instrumental in driving numerous policy changes within our organization."
VP, Senior Product Manager, US Bank

" height="29.26525980811059px" id="Eth71R0cp" transform="translate(50.52 7.877)" width="128.4356838868068px"/><path d="M 11.504 26.662 C 13.336 26.98 15.177 27.241 17.025 27.445 C 17.285 29.224 17.589 31.249 17.922 33.01 C 19.147 32.283 21.153 30.675 22.427 29.793 C 23.831 30.749 25.613 32.22 26.99 33.03 C 25.815 36.077 24.734 39.17 23.558 42.217 C 23.29 42.912 22.993 43.872 22.596 44.483 C 21.955 44.554 21.761 43.465 21.609 42.971 C 20.391 40.097 18.964 36.046 17.872 33.065 C 16.793 33.66 7.128 38.055 6.752 38.016 C 6.687 38.009 6.584 37.851 6.538 37.796 C 6.428 37.314 9.351 31.438 9.748 30.419 C 10.07 29.592 11.059 27.547 11.504 26.662 Z M 33.315 17.665 C 33.811 17.67 44.337 21.602 44.765 21.893 C 44.829 22.154 44.823 22.057 44.743 22.33 C 44.2 22.746 41.332 23.727 40.478 24.044 L 33.378 26.673 C 33.931 27.703 34.585 29.232 35.077 30.314 L 37.921 36.591 C 38.139 36.993 38.577 37.669 38.215 38.059 C 37.576 38.025 28.285 33.71 27.005 33.081 C 27.245 31.226 27.527 29.375 27.852 27.532 C 29.68 27.191 31.452 27.024 33.361 26.642 C 32.387 25.285 31.08 23.402 30.028 22.145 C 31.145 20.668 32.241 19.174 33.315 17.665 Z M 11.47 17.635 C 12.542 19.071 13.786 20.686 14.782 22.158 C 13.751 23.535 12.423 25.259 11.471 26.662 C 7.932 25.41 3.445 23.785 0 22.375 L 0 21.889 C 0.606 21.563 4.34 20.21 5.18 19.923 C 6.787 19.373 10.005 17.985 11.47 17.635 Z M 38.174 6.263 C 38.651 6.647 36.872 9.988 36.559 10.642 C 35.557 12.85 34.425 15.506 33.354 17.637 C 31.433 17.286 29.758 17.057 27.819 16.83 C 27.504 14.962 27.219 13.088 26.965 11.21 C 28.001 10.653 37.733 6.247 38.174 6.263 Z M 11.501 17.628 C 11.491 17.63 11.481 17.633 11.47 17.635 C 11.467 17.63 11.463 17.625 11.459 17.62 C 11.47 17.617 11.482 17.615 11.493 17.613 C 11.496 17.618 11.498 17.623 11.501 17.628 Z M 6.584 6.275 C 7.178 6.118 16.533 10.566 17.901 11.193 C 17.626 12.874 17.196 15.105 17.02 16.753 C 15.137 17.022 13.363 17.27 11.493 17.613 C 10.01 14.74 8.822 11.568 7.374 8.666 C 7.162 8.243 6.391 6.664 6.584 6.275 Z M 25.57 7.432 C 25.913 8.348 26.716 10.341 26.965 11.21 C 26.335 11.545 23.197 13.924 22.45 14.47 C 20.941 13.448 19.381 12.27 17.901 11.193 C 18.006 10.669 18.713 8.998 18.925 8.369 C 19.829 5.694 21.248 2.668 22.023 0 L 22.788 0 Z" fill="rgb(28, 26, 26)" height="44.486082377664px" id="u84SiQ2Nx" transform="translate(0 0.255)" width="44.80873390361835px"/></svg>)