
SBA 7(a) Prepayment Speeds Are Splitting: What the Second Exit Says About Credit Risk
Brett Caines
Data revision, September 25, 2026. This analysis originally reported a trailing-twelve-month voluntary prepayment rate of 8.4% as of March 31, 2026. SBA's subsequent data release, as of May 31, 2026, restated March 2026 prepayment activity, which had been understated in the prior file. The corrected rate is 9.2% (9.17%). Prepayment figures and charts throughout this article have been updated accordingly; default figures were not affected. The revision does not change the article's conclusions: voluntary prepayment remains below its 11–13% expansion range while defaults continue to rise.
Most small business loans never run their full term. They exit early in one of two ways: default, which gets all the attention, or voluntary prepayment, which gets ignored. But prepayment is the truer measure of borrower health, and lately it has been signaling something the default rate cannot.
Companion analysis. This piece extends SBA 7(a) Default Rates Hit 4.8%, which covers the credit side in full. Here we take up the other exit, voluntary prepayment. Read together, the two form the competing-risks view.
Key takeaways
Prepayment is the overlooked exit. Default triggers the guaranty purchase, so it gets the attention. Voluntary prepayment carries no credit loss, so it gets ignored, even though it costs the lender future interest and puts a secondary buyer's premium at risk. It is also the only half of the pair that reports on the borrowers who are doing fine.
Higher prepayment signals borrower health. Across both healthy expansions of the last thirty years it ran a steady 11% to 13% a year. It has fallen to about 9.2%, below that range, while defaults climb. Contained defaults have always arrived packaged with high prepayment. That link is now broken.
The break has little precedent. Defaults and prepayment moving in opposite directions like this has appeared only once before in thirty years, briefly, during the 2008 financial crisis.
The data settles the survivorship debate. If the default rise were an artifact of healthy borrowers leaving, the worst vintages would have prepaid the most. They prepaid the least. The rise is real credit deterioration, not a hollowed denominator.
Exit paths have split by borrower. Small, non-real-estate borrowers are trapped, prepayment falling as defaults rise. Large, real-estate-secured borrowers are still exiting, prepayment rising even as defaults climb.
Speed and credit now move together. A single portfolio-level prepayment assumption is wrong in both directions at once.
This is not the expansion of the 2010s, and the economists who track it have a name for the difference. The U.S. Bank Economics Research Group calls 2026 a K-shaped economy: one where higher-income households and stronger industries rise while, in their words, small businesses and lower-income consumers fall behind, a divide they attribute to higher-for-longer rates, elevated inflation, and AI investment. The headline numbers line up with that split. The Bureau of Economic Analysis put first-quarter real GDP at 2.1%, though reporting on the release noted the growth was driven mostly by AI-related capital spending rather than consumers. The Bureau of Labor Statistics counted 57,000 new jobs in June, which the Indeed Hiring Lab described as "slack water." Core PCE inflation ran 4.4% in the first quarter, with the policy rate still held high.
At Lumos, we do not forecast the macro economy. But the lending consequence of a K-shaped one is squarely our subject, and it is fairly simple: the 7(a) borrower sits on the lower arm of that K. The program exists, by statute, to serve businesses the conventional market will not, so its portfolio is concentrated in exactly the borrowers a K-shaped economy tends to leave behind. That is a large part of why 7(a) credit can deteriorate while bank C&I stays clean, and why the stress tends to show up here first.
Our recent default analysis ended with a point it noted but did not pursue: the secondary market already pairs a conditional default rate with a conditional prepayment rate, for a reason. This piece follows up on that point and works the reason out.
All figures here are drawn from loan-level SBA 7(a) data in the Lumos Data Portal.
THE SECOND EXIT · WHY THE OTHER HALF MATTERS
Prepayment is the overlooked exit
Every 7(a) loan leaves the portfolio eventually. Some run their full term and amortize to zero. Most of the rest leave early, and they do it in one of two ways. The first is involuntary: the loan defaults, which triggers the guaranty purchase and costs someone money. The second is voluntary: the borrower pays the loan off in full ahead of maturity, usually because they have refinanced into conventional debt or sold the business. Those two early exits are the competing risks, and they draw from the same shrinking pool of surviving loans. The conditional default rate (CDR) measures the first. The conditional prepayment rate (CPR) measures the second: the annual share of still-active loans that voluntarily pay off in full before maturity.
"A full payoff is a graduation."
Default gets the attention because it carries a credit loss, and prepayment gets overlooked because it does not. That is worth reconsidering. Prepayment is not free, it costs the originating lender the future interest it underwrote to, and it puts a secondary buyer's premium at risk when speeds run high. More to the point, it is the only one of the two that reveals anything about the borrowers healthy enough to walk away on their own terms. In a book under stress, that is exactly the population most easily lost from view.
THE HEALTH SIGNAL · PREPAYMENT ACROSS THIRTY YEARS
High and steady is what a healthy program looks like
It helps to read prepayment as a measure of borrower health. A borrower who retires a 7(a) note early has usually done it from a position of strength, having refinanced into cheaper conventional credit, or sold a business that someone wanted to buy. A full payoff, more often than not, is a graduation.
The record tends to support that. Through both of the healthy expansions in the last three decades, roughly 2004 to 2006 and again from 2013 to 2019, voluntary prepayment held fairly steady between about 11% and 13% a year, while defaults stayed toward the low end of their range. High, steady prepayment alongside contained defaults is close to what a healthy 7(a) book looks like. These are loans built to carry more risk than conventional credit, so the real test is not whether defaults are low in absolute terms. It is whether the strong borrowers are still graduating out, and whether the pool that remains still performs.
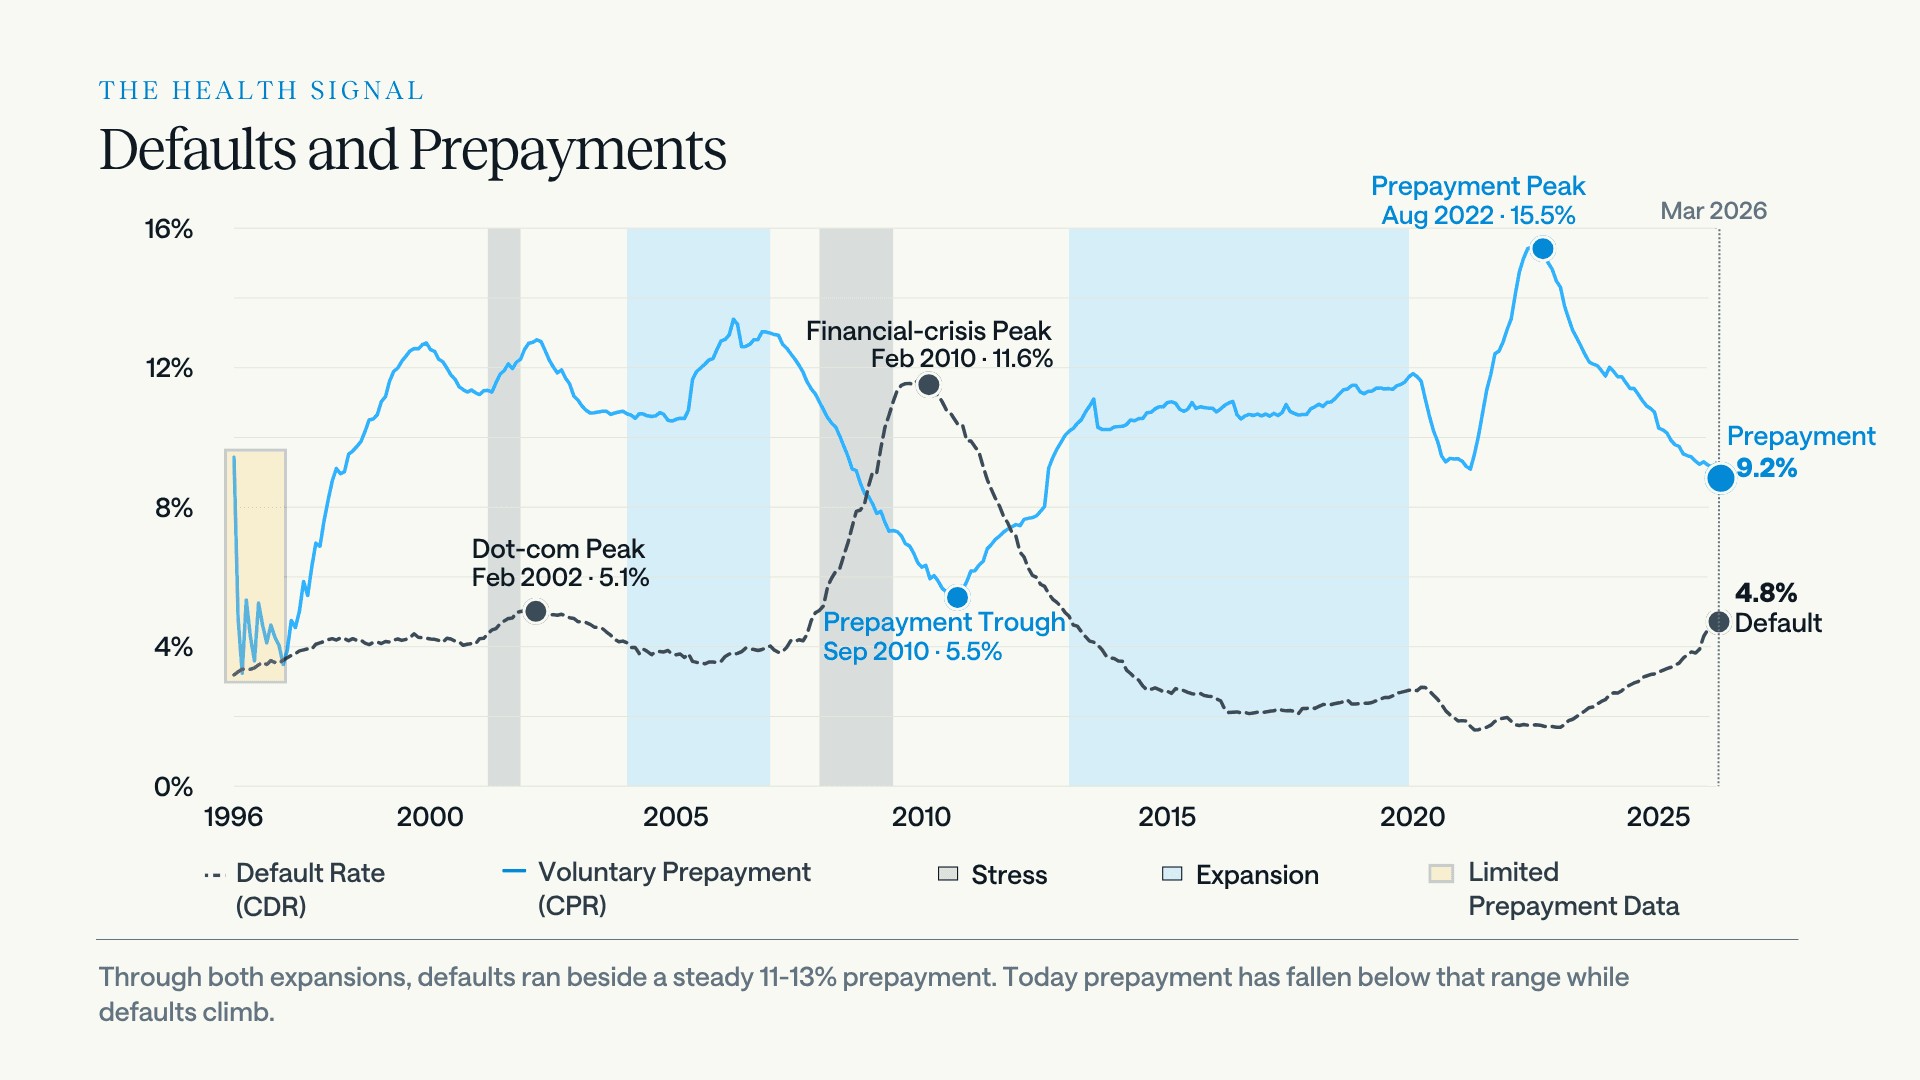
Two departures from that pattern are worth noting. The first was the financial crisis, when the prepayment rate fell to about 5.5% as the refinance and sale markets froze, and the exit door effectively shut for everyone at once. The second is now. Prepayment has fallen to about 9.2%, below its normal expansion range, while defaults climb toward a thirteen-year high. In every healthy period on record, contained defaults came packaged with high prepayment. That link is now broken: defaults up and prepayment down, together. Outside the crisis, the break does not appear anywhere in this data. The resemblance is in the pattern, not the cause. The crisis was a broad demand shock that hit every borrower at once. What we are looking at now is narrower and different in kind, and nothing here is a forecast of another one. It also raises a sharper question before anything else: is the rise even real?
THE SURVIVORSHIP TEST · IS THE DEFAULT RISE REAL
The prepayment data answers a question the default rate cannot
The previous default analysis relied on a mechanism it could describe but not fully prove. Conditional rates are measured against the surviving pool, and the loans that leave voluntarily tend to be the healthier ones, so the borrowers who remain are, over time, the weaker part of each cohort. That logic is sound but it also raises a fair question. If healthy borrowers prepay away quickly enough, the conditional default rate can climb even when nothing underneath has deteriorated. In that case the rise would mostly reflect who left, rather than reveal much about who stayed. An analysis built on default alone cannot settle that question, because the mechanism runs through prepayment, and prepayment is the one thing it does not measure.
There is a tempting shortcut worth addressing. Default itself comes in two versions: the rate measured against the loans still standing (the conditional rate), and the rate measured against every loan the cohort started with (the unconditional rate). The distance between those two is the denominator at work, and that distance could be read instead of prepayment itself. The trouble is that both versions are still measures of default. Neither one shows what carved the denominator down in the first place. Prepayment is what did that. It is not just another angle on the same number, it is the force that moves the number, and it is the only one of the three that reveals anything about the borrowers who left in good health.
With the prepayment data in hand, the test becomes fairly direct. If survivorship were inflating the numbers, the worst-performing vintages would be the ones that had prepaid the most. In fact, they are the ones that prepaid the least.
The FY2022 through FY2024 cohorts default roughly twice as fast as their predecessors did at the same loan age, a pattern documented in detail in our SBA 7(a) credit risk data analysis. On the prepayment side, those same cohorts have paid off far more slowly. By its third year, the FY2016 cohort had voluntarily retired about 27% of its original loans. The FY2023 cohort has retired only about 18.5%, while defaulting at 8.0% against FY2016's 3.1% at the same age. So these cohorts are failing more and leaving less, which means their surviving pools are fuller than their predecessors' were, not more hollowed out. So survivorship is not inflating these numbers. It is working against that explanation, because the worst cohorts hollowed out the least.

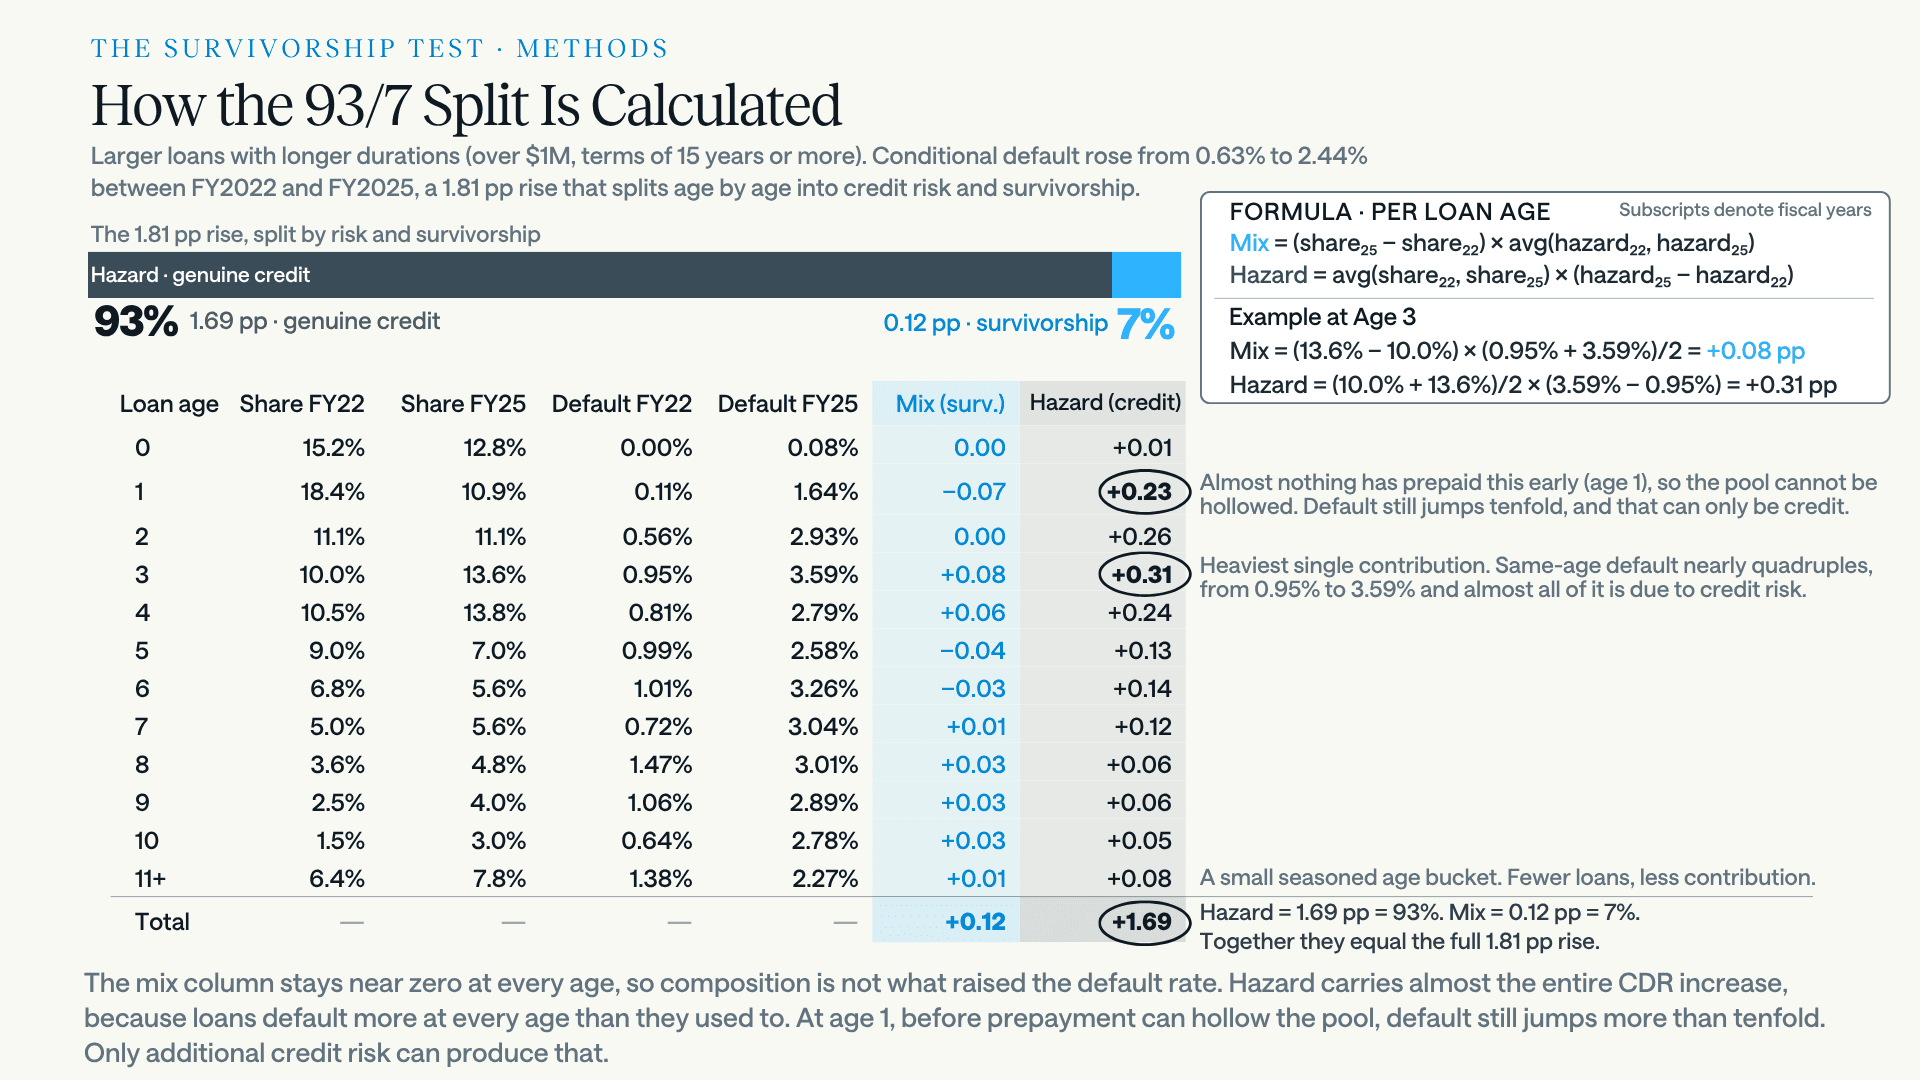
That answerss the question for the book as a whole. It leaves one segment where the objection still had some force: large, long, real-estate-secured loans, whose healthier borrowers are in fact still leaving quickly. When we run that same age-aligned decomposition on the segment by itself, the rise splits into roughly 93% genuine credit deterioration and about 7% survivorship. So even in the corner where the hollowing story was most plausible, it turns out to be a small correction rather than the cause. The prepayment data does not soften the default finding. It confirms it, and it closes off the one clean way the finding might otherwise be argued away.
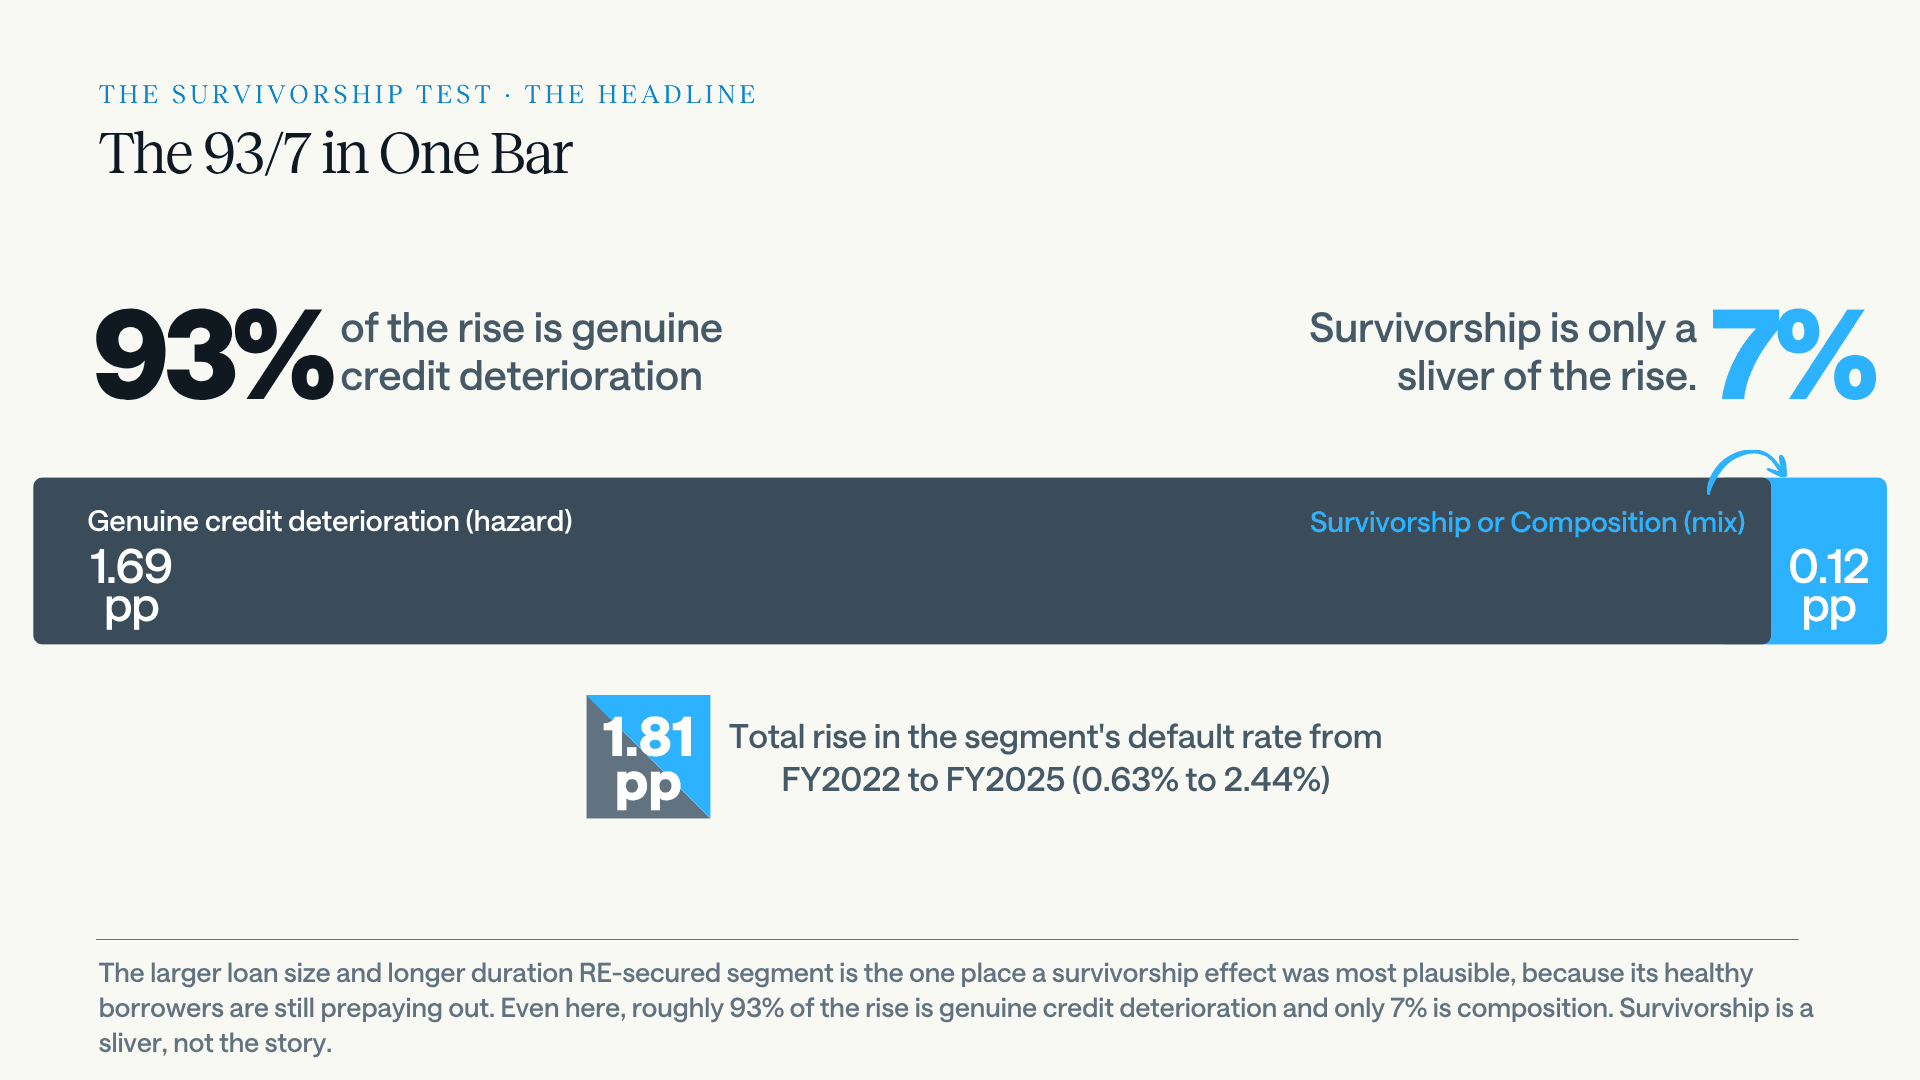
The age-by-age arithmetic behind this split, with the formula and a worked example, is laid out in the appendix for anyone who wants to reproduce it.
One more alternative deserves noting. The 2021 and 2022 prepayment surge, lifted by relief cash and unusually cheap exits, may have pulled future payoffs forward. If it did, today's low rate would be partly an air pocket, the payoffs already taken, rather than a door that has closed. That probably explains some of the dip, especially in the older cohorts that lived through the surge. It explains less of the recent ones. Loans originated after the surge, in 2023 and 2024, are prepaying below earlier vintages at the same age too, and they had no future to borrow against. The exit channels themselves point the same way. The Federal Reserve's Small Business Credit Survey finds the share of small-business applicants fully approved for financing still sitting below its pre-pandemic level, and the Kansas City Fed's Small Business Lending Survey shows banks have held credit standards on small business loans tight after the better part of four years of tightening. Business-for-sale volume cooled into 2026, down about 10% from a year earlier, and the brokers who handle those sales report tighter lending conditions, with sellers often carrying financing themselves to get deals closed. If low prepayment were only an air pocket, those channels would look open. They do not. So pull-forward is likely part of the story, not the whole of it.
Rates deserve the same scrutiny. Prepayment always tracks refinancing incentive, so part of the gap between today's 9.2% and the 11% to 13% of past expansions reflects a rate environment that is less friendly to refinancing rather than weaker borrowers. The aggregate level should not be read too literally on its own.
But rates do not explain the trouble away. They do not explain why defaults are climbing at the same time, which is the pairing this whole analysis rests on. And the symmetric case sharpens the point rather than softening it: if rates fall from here, refinancing incentive returns and prepayment likely revives, but for the borrowers who have options, the large and collateralized ones, not the small, non-real-estate borrowers whose barrier is credit and collateral rather than the coupon. Lower rates would lift the borrowers who were already healthy and leave the trapped segment trapped. That is the case for reading the split rather than the average. The aggregate level moves with the rate cycle. The divergence between the two halves does not.
THE SPLIT · PREPAYMENT BY BORROWER
One book, two exit doors
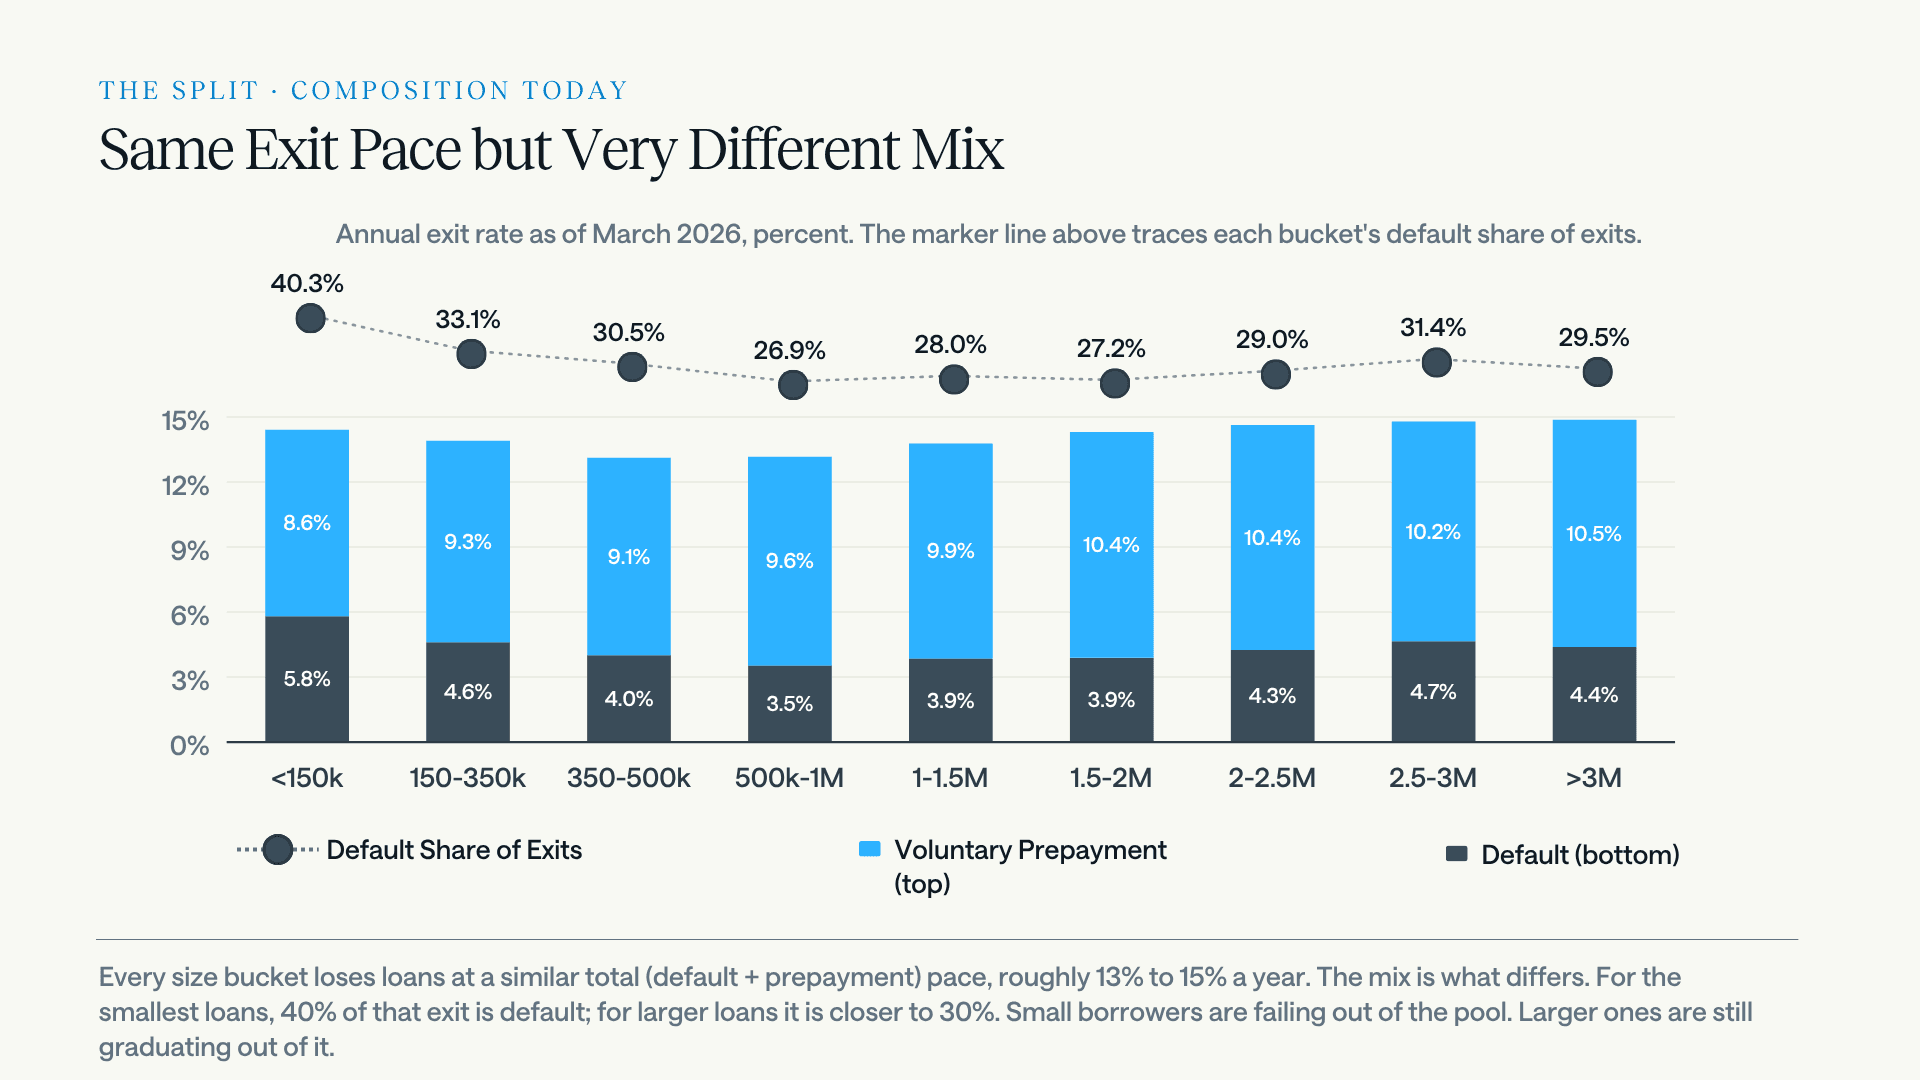
The more actionable finding is that prepayment has stopped behaving uniformly across the book. It has split along collateral lines, and the two halves are now moving in opposite directions.
Smaller, shorter-term, non-real-estate borrowers are increasingly trapped. For these loans, prepayment has fallen sharply even as defaults rose, with the smallest band's prepayment dropping by roughly three points. These borrowers generally cannot refinance out: conventional small-firm credit has tightened, rates are high, and they have no real estate to pledge against. So they tend to stay in the pool, and a growing share of them fail. For them, the exit door has effectively shut.
Larger, longer-term, real-estate-secured borrowers are still moving. For these loans, prepayment actually rose even as defaults climbed. A lender willing to refinance one of them into conventional real-estate debt is, in effect, vouching for the borrower's credit, and many are taking that offer. For this group, the exit door has widened.
Measured against the 2015 to 2019 expansion rather than the 2021 trough, the same segment reads differently: prepayment on the largest, longest credits is marginally above its expansion average rather than rising off a low. Our analysis of C&I aggregates works through why the base year changes the answer here, and reaches the same conclusion about these borrowers on a different reference point.
The default analysis found that the size-risk curve had bent into a U, with the largest loans deteriorating fastest. What we are seeing here is the prepayment-side reading of that same divide: collateralized borrowers who kept their options, and uncollateralized ones who lost them. Size and term turn out to be two views of a single split running through the borrower base.
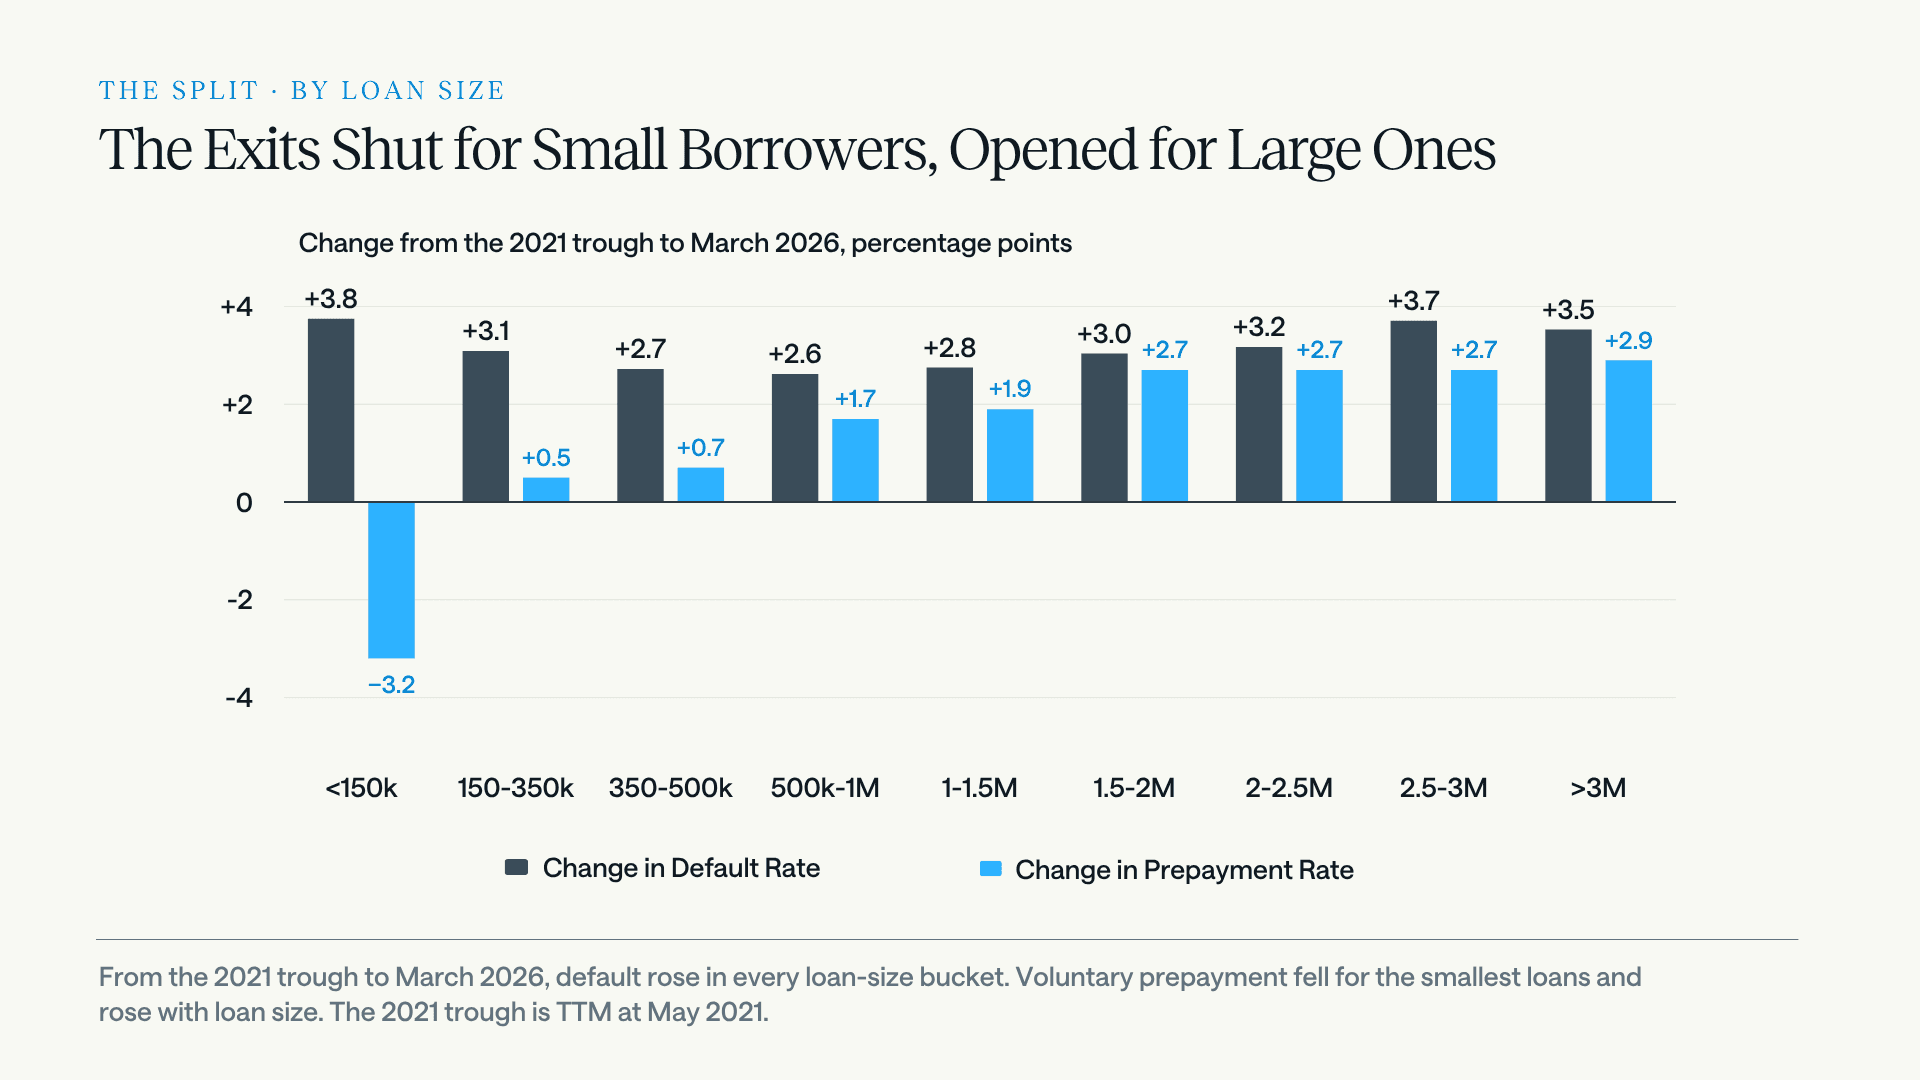
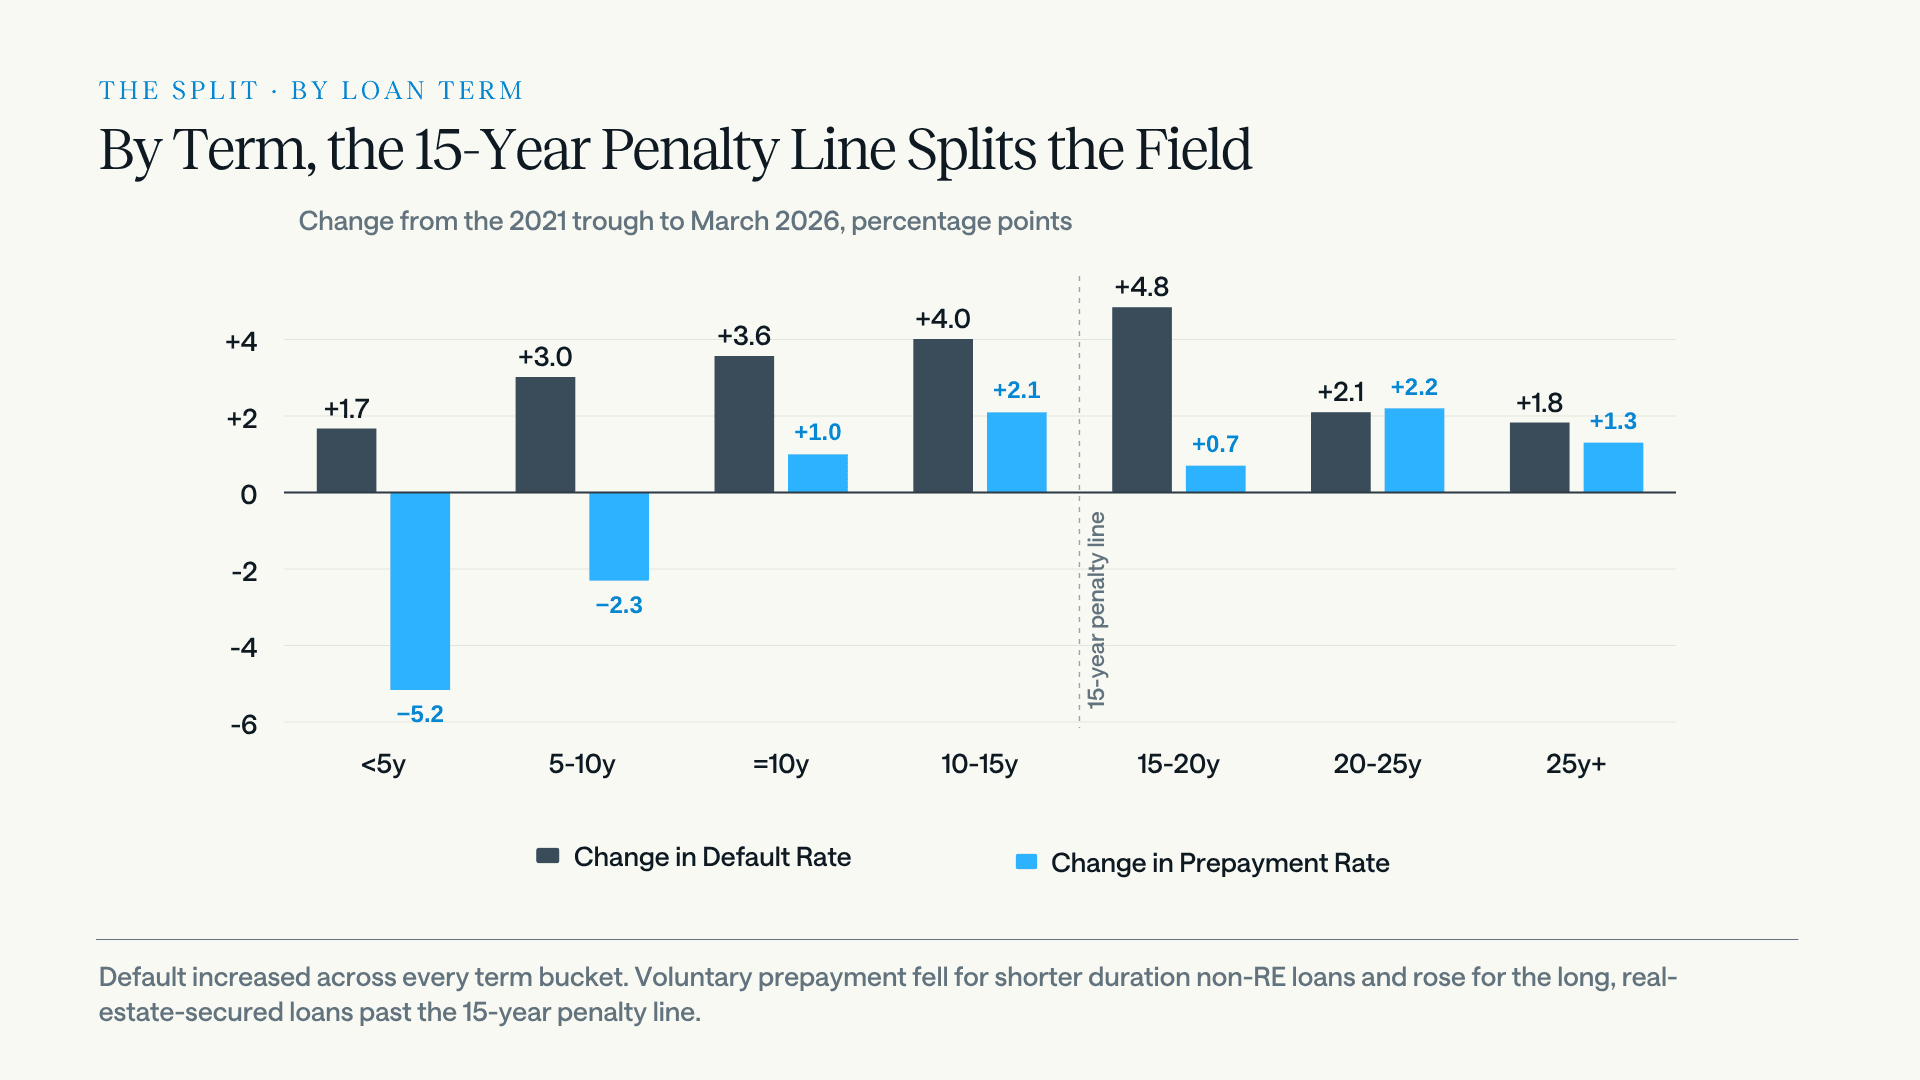
That divergence shows up in how each borrower exits today. Loans leave at a similar total pace across every size bucket. What differs is the mix of that exit, default versus voluntary payoff, and that now depends on the borrower.
THE DURATION PROBLEM · WHAT THE GUARANTEED PORTION SHOULD READ
Speed and credit stopped being separate variables
"In this market, stuck and at-risk have become very nearly the same condition."
For anyone holding or pricing the guaranteed portion, this split carries a consequence that a single portfolio-level number tends to hide.
A single prepayment assumption applied across the whole book is now wrong in both directions at once. Small, non-real-estate collateral is prepaying more slowly, which extends duration and, less comfortably, keeps those borrowers inside a weakening pool. Large, real-estate collateral is prepaying faster, which shortens duration while draining the healthiest credits out of what remains. In other words, prepayment speed and credit quality have become correlated by segment. They are better modeled jointly, and by segment, because a single blended assumption will get the speed wrong for one group and the loss wrong for the other.
The shorter version is this. Defaults and prepayments are not two separate stories. They are one story about which borrowers can still choose to leave and which ones are stuck. And in this market, stuck and at-risk have become very nearly the same condition.
There is a reason this reaches beyond the buyers who price the paper. Many lenders sell the guaranteed portion precisely to free up capital and balance-sheet capacity to make the next loan, so a healthy secondary market is part of what keeps 7(a) origination flowing. Not every lender sells, but enough do that when prepayment behavior turns erratic and premiums come under pressure, the effect does not stay with investors. It can reach the program's core purpose, which is expanding small businesses' access to capital.
THE CROSS-CHECK · DOES ANYTHING ELSE SEE IT
The exit shut where the outside data says it should
The mechanism behind the split holds up reasonably well against outside data. In the Federal Reserve's January 2026 loan officer survey, banks said they expected loan quality to deteriorate specifically for small firms over 2026, while holding roughly steady for large and middle-market firms. Standards on small-firm lending stayed tight after years of steady tightening, which is precisely what keeps the conventional-refinance exit narrow for the smallest borrowers and holds down their prepayment. The prime rate, which is the coupon base for most 7(a) loans, ran from 3.25% in early 2022 up to a peak of 8.5% before easing back toward 6.75%, keeping the refinance alternative expensive for the borrowers who most need it. The exit, in short, shut about where the outside data says it should have.
THE TAKEAWAY · READ BOTH EXITS
Prepayment is the confirmation, not the footnote
The default rate shows how many 7(a) loans are failing. Prepayment shows how many borrowers can still choose to leave. Read together, they show something neither shows alone.
Prepayment has fallen below the 11% to 13% it held through past expansions while credit risk climbs, a pairing that has almost no precedent in thirty years of this data. It has split fairly cleanly between trapped small borrowers and still-liquid large ones. And it takes the survivorship objection off the table: the vintages driving defaults up are the ones that prepaid the least, so the rise is real. For a holder of the guaranteed portion, then, the competing-risks view is not a refinement. It is the difference between a duration assumption that holds and one that does not.
None of this needs a recession to explain it, which is the part that unsettles people. The explanation is structural rather than cyclical. A K-shaped economy leaves small, often uncollateralized businesses on the lower arm, and the 7(a) book is concentrated there by design. High rates press on floating-rate borrowers while tighter small-firm credit shuts the refinance exit, and both land hardest on exactly the population the program was built to serve. Defaults rise, prepayment falls, and neither one is waiting on a downturn to get worse.

About this analysis
Prepayment and default figures were built from SBA 7(a) loan-level data in the Lumos Data Portal, where historical prepayment and default rates can be viewed by loan size, term, industry, and lender, in any combination. For a lender's own book, Portfolio Insights predicts credit risk across the existing portfolio, and Prime+ scores new applications at origination.
FAQ: SBA prepayment and competing risks, answered
What is the conditional prepayment rate (CPR) on SBA 7(a) loans?
CPR is the share of still-active 7(a) loans that voluntarily pay off in full in a given period. In this analysis, prepayment means a loan paid in full at least three months before maturity, a full voluntary exit kept distinct from scheduled maturity and from partial paydowns. It is the voluntary counterpart to the conditional default rate, and the secondary market reads the two side by side for exactly that reason.
What is a competing-risks view of SBA loans?
It treats default and voluntary prepayment as two exits drawing from the same pool of surviving loans, and reads them together rather than in isolation. Doing so shows whether a rising conditional default rate reflects real credit stress or only a change in who remains. Since 2022 the two have moved in opposite directions, defaults up and prepayment down, which is the combination that signals genuine stress.
Why did SBA 7(a) prepayment speeds fall in 2026?
Voluntary prepayment dropped from a 2022 peak near 15.5%, a level partly inflated by pandemic relief and unusually cheap exits, to about 9.2% because the healthy-exit channel narrowed. Elevated rates and tighter small-firm credit made refinancing into conventional debt harder, and the business-sale market cooled. The decline is concentrated in smaller, non-real-estate borrowers, who have no collateral to refinance against.
Does prepayment data confirm the SBA default rise is real, not survivorship?
Yes. If rising conditional defaults were an artifact of healthy borrowers prepaying away, the worst vintages would be the ones that prepaid the most. In fact they prepaid the least. By year three the FY2023 cohort had retired about 18.5% of its loans against roughly 27% for FY2016, while defaulting at 8.0% versus 3.1%. Because these cohorts are failing more while leaving less, their surviving pools are fuller rather than hollower, which means the deterioration is genuine.
How does SBA 7(a) prepayment differ by loan size and term?
It has split by collateral. Smaller, shorter-term, non-real-estate loans show falling prepayment alongside rising defaults, the signature of borrowers who cannot refinance out. Larger, real-estate-secured loans show rising prepayment even as defaults climb, because those borrowers still hold refinance and sale options.
What does falling prepayment mean for buyers of the guaranteed portion?
Prepayment speed and credit quality are now correlated by segment, so a single portfolio-level speed assumption misleads in both directions. Small non-real-estate collateral is extending in duration inside a weakening pool, while large real-estate collateral is shortening as its healthiest names exit. Conditional prepayment and conditional default are best modeled jointly and by segment.
What do the prepayment and default analyses conclude together about SBA 7(a) credit?
Read together with the prior default analysis, they show that the recent rise in conditional default is genuine credit deterioration, not a survivorship artifact: the worst-performing recent cohorts prepaid the least, leaving fuller pools rather than hollowed ones. The deterioration is concentrated in smaller, non-real-estate borrowers who have lost their exit options, while larger, collateralized borrowers still refinance and sell. That pattern is consistent with a bifurcated economy pressing hardest on the borrowers the 7(a) program is built to serve, so elevated defaults here reflect the program absorbing risk by design rather than a break in its function. Separating how much of the recent vintages' weakness traces to origination-era underwriting from how much reflects later macro stress would require loan-level underwriting data across cycles, a separate question this analysis does not resolve.
Notes & Sources
Measurement. Default and prepayment rates here are conditional, also called survival-based, by loan count. Each period's denominator considers the loans still active in that period, which isolates the behavior of the surviving pool independent of how quickly loans leave. The companion default analysis covers the conditional framework and the vintage default curves in full.
Prepayment definition. A loan paid in full at least three months before maturity. This is a voluntary, terminal exit. It excludes scheduled maturity, and it excludes partial paydowns and curtailments, which do not remove a loan from the pool.
Vintage and segment figures. Cohort figures are aligned at loan age zero. Cumulative prepayment by cohort is measured as a share of the original loan count. The large-and-long segment covers loans over $1 million with terms of fifteen years or more. Its default rise is split into a genuine-credit component (same-age hazard) and a survivorship component (age-and-vintage mix) using a shift-share decomposition of the segment's conditional default rate by loan age, measured from the FY2022 trough to FY2025. Because pandemic relief suppressed FY2022 defaults, we also ran the split from a clean pre-pandemic FY2019 baseline. The result is essentially unchanged, roughly 93% genuine credit and 7% survivorship either way, so the finding does not depend on the stimulus-distorted trough. The COVID-era distortion of both defaults and prepayment is covered in the companion default analysis.
External data. Federal Reserve, Senior Loan Officer Opinion Survey, January 2026. Federal Reserve / FRED, Bank Prime Loan Rate (MPRIME) and business-loan delinquency (DRBLACBS, used as a proxy for bank C&I performance). U.S. Bank Economics Research Group, The K-economy in 2026: Same story, new amplifiers. U.S. Bureau of Economic Analysis, Gross Domestic Product and core PCE price index, first quarter 2026 (third estimate). U.S. Bureau of Labor Statistics, Employment Situation, June 2026. Indeed Hiring Lab, June 2026 labor market updates. On the exit channels: Federal Reserve, Small Business Credit Survey, 2026 Report on Employer Firms, for the share of applicants fully approved relative to pre-pandemic levels, and the Federal Reserve Bank of Kansas City, Small Business Lending Survey, for bank-reported credit standards on small business loans; BizBuySell Insight Report for business-for-sale transaction volume; and the IBBA and M&A Source Market Pulse Survey for broker-reported lending conditions and use of seller financing.
Data. SBA 7(a) loan-level data from the Lumos Data Portal. Analysis and charts by Lumos.
Companion analysis. SBA 7(a) Default Rates Hit 4.8%: What the Credit Data Says About Small Business Risk.
Appendix: How the 93/7 split is calculated
For the reader who wants to reproduce the large-and-long segment's 93/7 split, the table below carries the full age-by-age decomposition, along with the formula and a worked example.
Book a 30-minute demo. No pressure, no sales pitch. Just a straightforward conversation about whether Lumos is right for you.
What To Expect:
Quick platform overview
Live demo with real loan examples
Discussion of your specific needs
Clear next steps
"The data and insights provided by Lumos have been instrumental in driving numerous policy changes within our organization."
VP, Senior Product Manager, US Bank

" height="29.26525980811059px" id="Eth71R0cp" transform="translate(50.52 7.877)" width="128.4356838868068px"/><path d="M 11.504 26.662 C 13.336 26.98 15.177 27.241 17.025 27.445 C 17.285 29.224 17.589 31.249 17.922 33.01 C 19.147 32.283 21.153 30.675 22.427 29.793 C 23.831 30.749 25.613 32.22 26.99 33.03 C 25.815 36.077 24.734 39.17 23.558 42.217 C 23.29 42.912 22.993 43.872 22.596 44.483 C 21.955 44.554 21.761 43.465 21.609 42.971 C 20.391 40.097 18.964 36.046 17.872 33.065 C 16.793 33.66 7.128 38.055 6.752 38.016 C 6.687 38.009 6.584 37.851 6.538 37.796 C 6.428 37.314 9.351 31.438 9.748 30.419 C 10.07 29.592 11.059 27.547 11.504 26.662 Z M 33.315 17.665 C 33.811 17.67 44.337 21.602 44.765 21.893 C 44.829 22.154 44.823 22.057 44.743 22.33 C 44.2 22.746 41.332 23.727 40.478 24.044 L 33.378 26.673 C 33.931 27.703 34.585 29.232 35.077 30.314 L 37.921 36.591 C 38.139 36.993 38.577 37.669 38.215 38.059 C 37.576 38.025 28.285 33.71 27.005 33.081 C 27.245 31.226 27.527 29.375 27.852 27.532 C 29.68 27.191 31.452 27.024 33.361 26.642 C 32.387 25.285 31.08 23.402 30.028 22.145 C 31.145 20.668 32.241 19.174 33.315 17.665 Z M 11.47 17.635 C 12.542 19.071 13.786 20.686 14.782 22.158 C 13.751 23.535 12.423 25.259 11.471 26.662 C 7.932 25.41 3.445 23.785 0 22.375 L 0 21.889 C 0.606 21.563 4.34 20.21 5.18 19.923 C 6.787 19.373 10.005 17.985 11.47 17.635 Z M 38.174 6.263 C 38.651 6.647 36.872 9.988 36.559 10.642 C 35.557 12.85 34.425 15.506 33.354 17.637 C 31.433 17.286 29.758 17.057 27.819 16.83 C 27.504 14.962 27.219 13.088 26.965 11.21 C 28.001 10.653 37.733 6.247 38.174 6.263 Z M 11.501 17.628 C 11.491 17.63 11.481 17.633 11.47 17.635 C 11.467 17.63 11.463 17.625 11.459 17.62 C 11.47 17.617 11.482 17.615 11.493 17.613 C 11.496 17.618 11.498 17.623 11.501 17.628 Z M 6.584 6.275 C 7.178 6.118 16.533 10.566 17.901 11.193 C 17.626 12.874 17.196 15.105 17.02 16.753 C 15.137 17.022 13.363 17.27 11.493 17.613 C 10.01 14.74 8.822 11.568 7.374 8.666 C 7.162 8.243 6.391 6.664 6.584 6.275 Z M 25.57 7.432 C 25.913 8.348 26.716 10.341 26.965 11.21 C 26.335 11.545 23.197 13.924 22.45 14.47 C 20.941 13.448 19.381 12.27 17.901 11.193 C 18.006 10.669 18.713 8.998 18.925 8.369 C 19.829 5.694 21.248 2.668 22.023 0 L 22.788 0 Z" fill="rgb(28, 26, 26)" height="44.486082377664px" id="u84SiQ2Nx" transform="translate(0 0.255)" width="44.80873390361835px"/></svg>)