
Small Business Credit Risk Models: How to Evaluate One, and Whether to Build or Buy
Brett Caines
Every small business lender already has a credit risk model. In most institutions it is a committee, a spreadsheet, and a decade of accumulated instinct about which borrowers repay. That model works. It is also slow, difficult to audit, and impossible to point at a portfolio and ask what it would have said.
The interest in statistical alternatives follows from those three limits rather than from any claim that judgment is failing. What a formal model offers is not better instinct. It is instinct that can be written down, applied identically to the ten thousandth file and the first, and checked against what happened. The useful question is not whether a model is accurate. It is whether the lender can tell.
What a Small Business Credit Risk Model Predicts
A small business credit risk model is a statistical model that estimates the likelihood a small business borrower will fail to repay, and the loss the lender would absorb if that happened, using loan characteristics, borrower financials, and economic conditions.
Three quantities do most of the work. The probability that a loan fails to perform over a stated horizon is the probability of default, or PD. The share of exposure a lender does not recover after a default is the loss given default, or LGD. Their product, multiplied by exposure, is the expected loss, or EL, which converts a credit opinion into a dollar figure a pricing committee and an allowance methodology can both use.
The horizon matters more than most model comparisons admit. A twelve-month PD and a lifetime PD are different measures answering different questions, and a lender that swaps one for the other will misread its own portfolio. The distinction is not only a modeling preference. Under the current expected credit loss standard, FASB ASC 326, institutions estimate credit losses over the contractual life of an asset at origination, which is a lifetime question that a twelve-month model does not answer. Lumos Prime+ predicts average annualized credit risk over the full life of a loan, which is why its predictions for young, currently performing loans sit closer to the predictions for known defaults than to the predictions for seasoned performers. Those young loans have not yet had the chance to fail. A lifetime model says so.
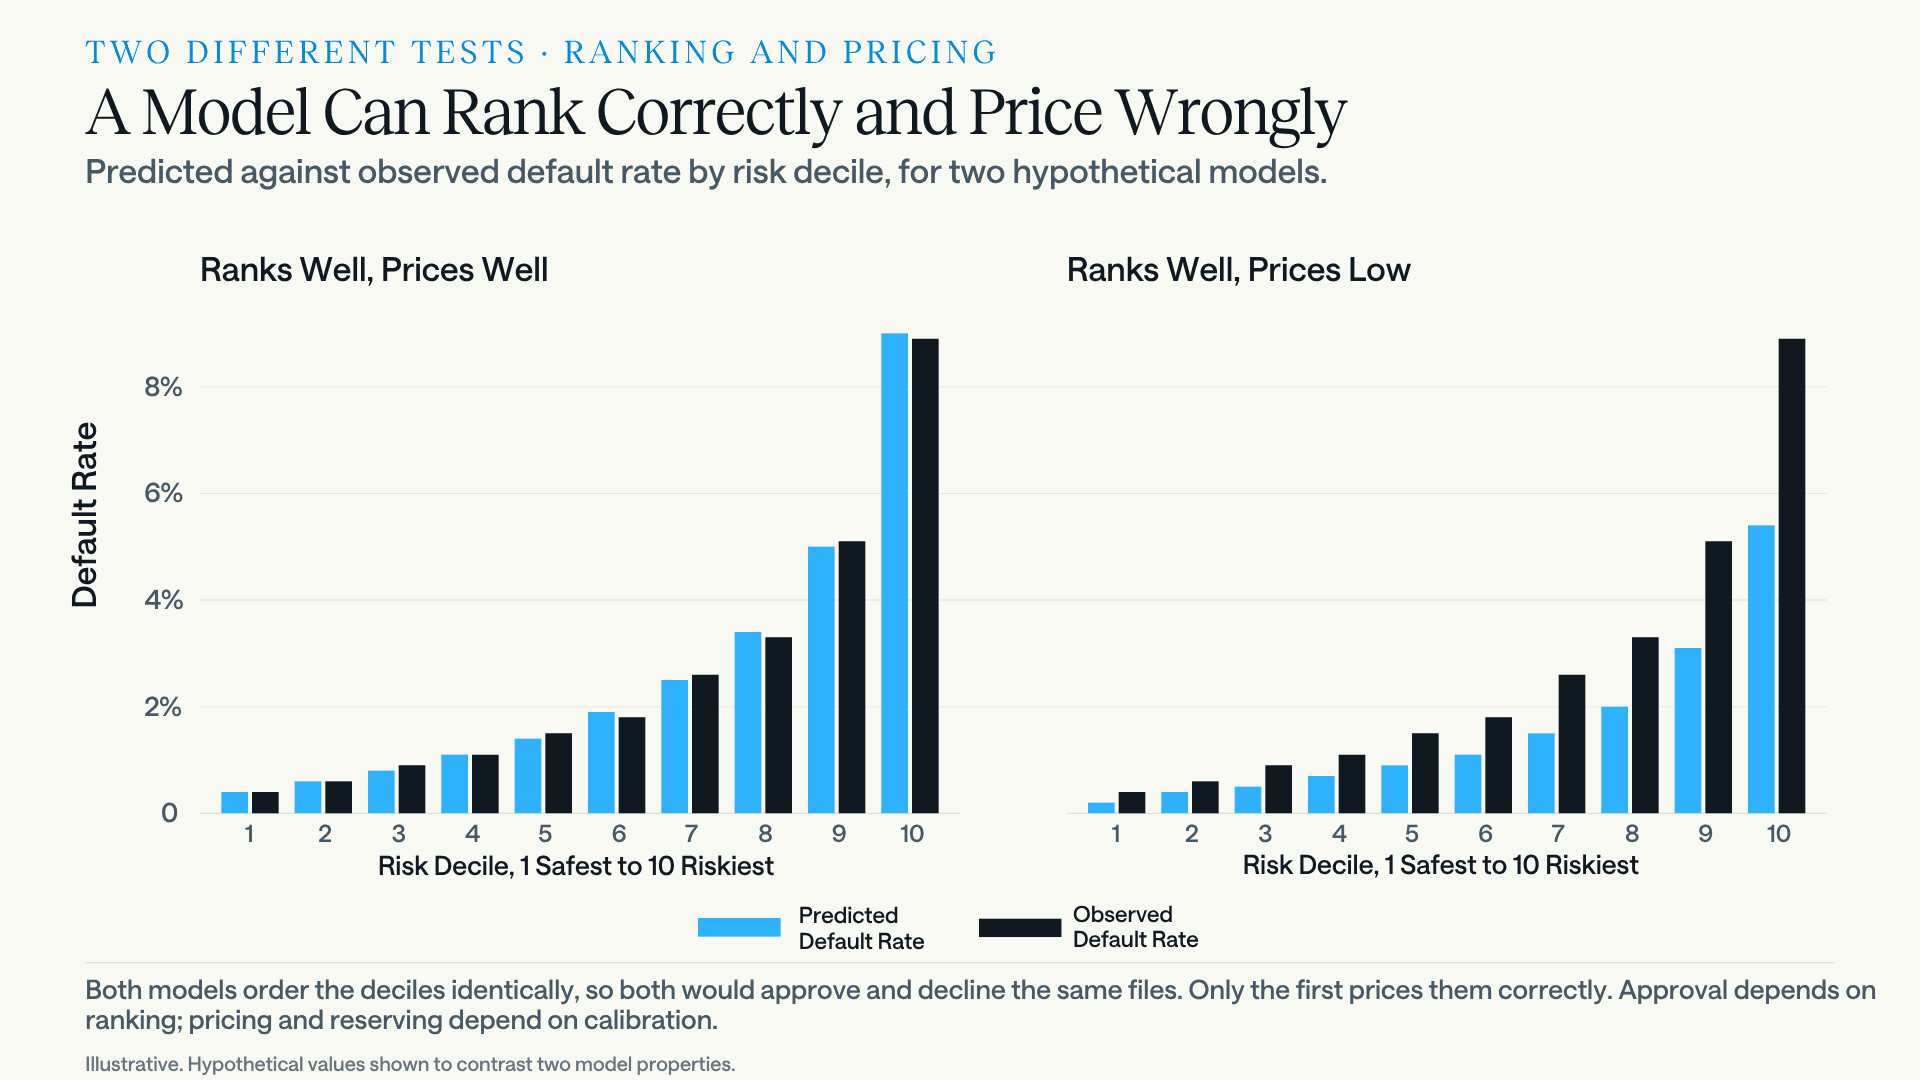
Two further terms separate a model that ranks well from a model that is right. Rank ordering, which model validation literature calls discrimination, is the model's ability to sort borrowers so that the loans that default sit above the loans that do not. Calibration is whether the predicted numbers match observed reality, so that files scored at a 3% default probability default at roughly 3%. A model can rank well and be badly calibrated. The approvals stay correct and the loss forecasts do not, so a lender pricing off it sets its rates too low across the whole book while every individual decision still looks defensible. Pricing and reserving depend on calibration. Approval depends on ranking. A lender should know which one a vendor is demonstrating.
What a Credible Validation Looks Like
The standard measure of rank ordering is the area under the receiver operating characteristic curve, or AUC, which describes how reliably a model ranks a defaulted loan above a performing one. An AUC of 0.5 is a coin flip. An AUC of 1.0 is perfection, and in credit it usually indicates a leak in the data rather than a triumph.
Published AUC figures are close to meaningless without the conditions attached to them. Three conditions carry most of the weight.
Out-of-time testing. A model scored on the same period it was fitted on will look strong and prove nothing. The honest version holds out later origination years and reports performance separately for each.
Loan seasoning. Seasoning is the age of a loan relative to the period in which defaults typically occur. Recent vintages have not had time to fail, so a lifetime model tested against them will appear to underperform even when its predictions are sound. This is the single most common way small business default prediction results are misread, in both directions.
Scored declines. Approved books are survivor populations, screened by the same underwriters the model claims to reproduce. A test run only on them cannot answer the question that matters most, which is whether the model would have caught what underwriting caught. Scoring the declines answers it. Ranking inside an already-screened book is also harder than ranking across everything that walked in the door, which makes an approved-only figure a floor rather than a flattering one.
The Lumos Prime+ validation for conventional business lending was built around those three conditions, and its numbers are worth reading with the conditions in view. Lumos modeled 88,917 applications from five conventional lenders, including 34,372 approved applications containing 792 defaults, a default rate of roughly 2.3% that reflects how imbalanced this problem is. Declined applications were scored alongside approved ones, and within each lender's portfolio the declined files generally drew the highest predicted PDs of any group. That result is the model agreeing with underwriters who had information the model never saw.
Performance by origination year tells a more mixed and more informative story. For loans originated before 2023, AUC was approximately 0.70, and above 0.70 in every year of that cohort except 2019. The 2019 exception was 0.626, driven by a concentration in industries that pandemic conditions hit disproportionately, which is a real limitation and not one worth explaining away. For 2023 and later originations, AUC was 0.656. Those recent cohorts also show lower cumulative default rates than the earlier ones, from 3.27% in 2019 down through 2.93% in 2022, then 1.69% in 2023 rising to 1.99% in 2025. The most plausible reading is that the recent loans have not finished defaulting yet, which makes the reported figures a floor rather than a ceiling. That reading is also a prediction, and it will be falsifiable as those cohorts mature.
For lifetime default prediction on a partially seasoned commercial book, roughly 0.70 is a strong figure, and what it bought is more informative than the number itself: in that seasoned portfolio it placed 35% of all defaults in the riskiest tenth of the book. A vendor reporting 0.85 on small business credit should be asked immediately about horizon, seasoning, and whether the outcomes it was scored against were observed or inferred.
What the Model Is For: Reordering the Book
Rank ordering statistics are abstract. What a credit committee wants to know is what changes.
The practical answer sits in the risk deciles. Across a seasoned portfolio of 12,823 loans, the riskiest decile identified by Prime+ contained 35% of all defaults, and the ninth decile another 13%. Following that ranking, declining the riskiest 20% of applications would have avoided about 50% of historical defaults in that seasoned, pre-2023 data set.
That figure needs its boundary stated plainly. It is retrospective, drawn from loans whose outcomes are already known, and the 20% reduction in approvals is a gross number. It does not net out the previously declined applications the model scored as safe, which a lender could have approved instead, nor the applications lost to competitors during slow manual review. Whether the trade is worth making depends on a lender's own pricing and cost of funds, which is a judgment no model makes.
The structural point survives the caveats. Defaults are not spread evenly across a book, so a model that ranks accurately lets a lender give up a small, chosen share of volume in exchange for a disproportionate share of future losses. We argued the broader version of this case in The Growth vs. Risk Myth, and the decile evidence above is what that argument looks like in a conventional portfolio.
One measurement caution belongs here. Portfolios shrink for two reasons, and only one of them is bad. Healthy borrowers refinance away, which raises the observed default rate on what remains without any deterioration in credit. Any model evaluation that ignores prepayment will misattribute survivorship to risk, a point developed in our analysis of SBA 7(a) prepayment speeds.
A disclosure belongs here, before the argument reaches the decision it is pointed at. Lumos sells one of the two options under discussion, which makes what follows the work of an interested party. The reasonable response is to weigh the evidence rather than the framing, and the evidence above was reported with its weakest results intact for that reason.
The Case for Building
Building has real advantages, and they are usually understated by vendors.
An internal model can be trained on the exact population a lender serves, which matters most for institutions with a genuine concentration, whether in a franchise system, a region, or an industry. Internal models also carry no per-decision cost, integrate with whatever the institution already runs, and leave the intellectual property in house. For a lender whose credit strategy is its competitive advantage, that last point is not sentimental.
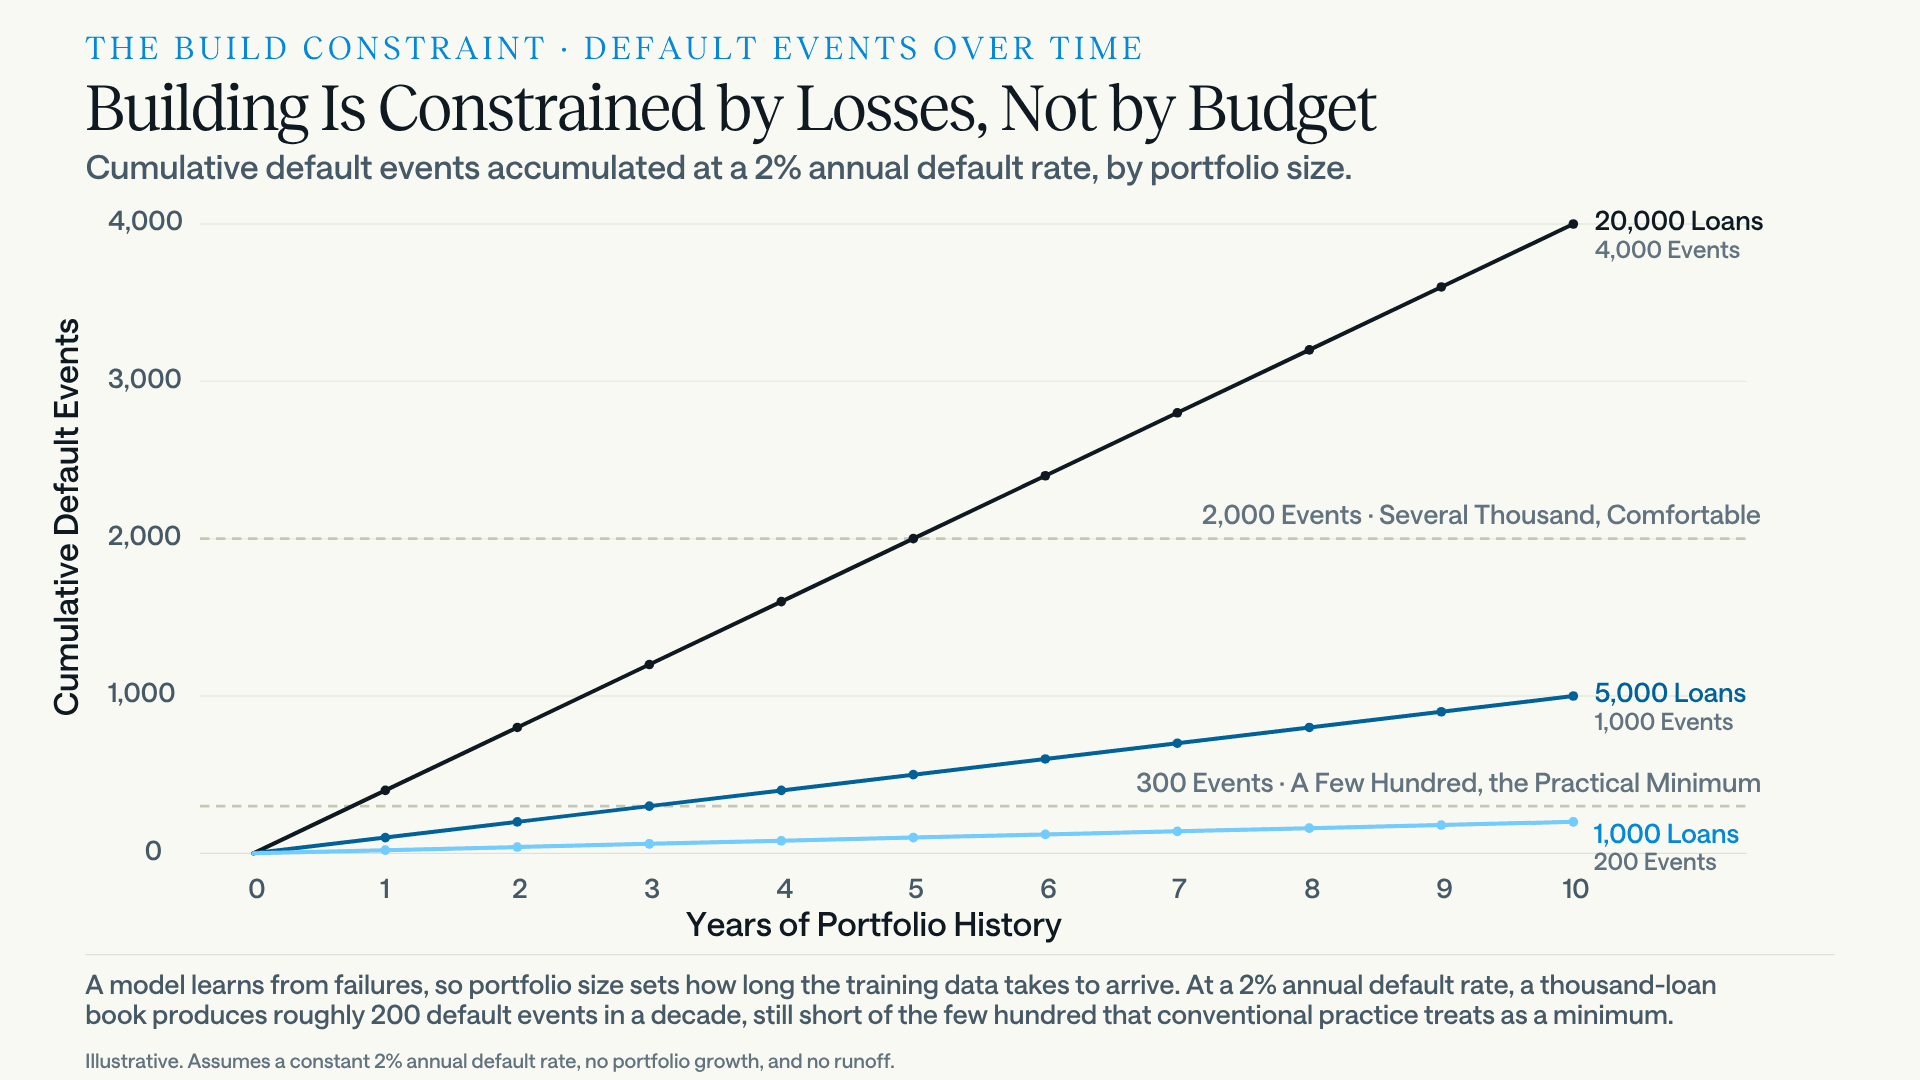
The binding constraint is defaults rather than loans. A model learns from failures, so the relevant question is not how large the book is but how many defaults it has produced across varied conditions. Conventional modeling practice wants a few hundred default events at minimum, spread across enough time to include at least one period of stress, and preferably several thousand. A lender with five thousand loans on the book, roughly a $500 million portfolio at typical small business loan sizes, produces about a hundred defaults a year at a 2% annual default rate, which means the training data for a model that survives a downturn takes the better part of a decade to accumulate, and the decade has to include a downturn.
Two costs follow. The first is regulatory. Models used in credit decisions sit under the interagency model risk management guidance, which the Federal Reserve, OCC and FDIC reissued jointly in April 2026 as SR 26-2, superseding the SR 11-7 framework that had governed the field since 2011. The revised guidance is deliberately more proportionate, scaled to an institution's size and model risk profile, aimed most directly at organizations above $30 billion in assets, and explicit that it does not set enforceable standards. The core disciplines survive the rewrite: independent validation, documented development, ongoing monitoring, and governance that outlasts the departure of the person who wrote the code. Most institutions that abandon a build project abandon it here rather than at the modeling stage.
The second cost is the one that does not appear in a budget. A model that learns from a lender's own defaults must wait for those defaults to occur. The cost of building is not measured in salaries. It is measured in the losses required to learn from.
The Case for Buying
The argument for buying is mostly an argument about pooled data and elapsed time. A vendor model is trained on many institutions across multiple cycles, which is the only way to see stress conditions an individual lender has not personally lived through. Prime+ draws on more than two million small business loans and thirty years of performance history for exactly this reason. Validation, monitoring, and documentation arrive with the model rather than being built alongside it, and deployment is measured in weeks.
The trade-offs are real and should be priced. A vendor model is calibrated to a national population that may not match a specialized book. There is a per-decision cost. There is concentration risk in depending on an outside party for a core credit function, and buying does not move the supervisory burden: responsibility for a vendor model's outputs and limitations stays with the institution using it. And transparency varies enormously across vendors, which is the difference between a model a credit committee can defend to an examiner and a score nobody can explain. Any purchased model should return the factors driving each decision, not only the decision. Lenders comparing purchased scores specifically against bureau-based alternatives will find that comparison worked through in our analysis of small business credit scores and FICO SBSS alternatives.
There is a third path that gets less attention than it deserves. A lender can buy a model, run it in parallel against its own decisions without acting on it, and accumulate the evidence that would justify either continuing or building. Retrospective scoring of past originations and past declines produces that evidence in weeks rather than years, and it is cheap relative to being wrong in either direction.
How the Decision Usually Breaks
The honest summary is that scale decides most of it. Institutions with large, concentrated, well-instrumented portfolios and existing quantitative staff can build models worth having. Institutions without all four of those conditions generally cannot, and the ones that try tend to produce a model that works on the population it was fitted to and degrades quietly on everything since.
Timing is pressing on the decision from one side. Prime+ predictions on conventional business loans show average predicted PD rising from under 0.5% for 2019 through 2021 originations to over 1.5% for 2024 and 2025. That is a tripling in predicted risk on conventional credit. On the program side, the SBA 7(a) portfolio's twelve-month default rate reached 4.8% in March 2026, which we examined in detail in SBA 7(a) Default Rates Hit 4.8%. These are different populations and the figures should not be blended, but they point the same direction.
At Lumos, we do not forecast the macro economy, and nothing above should be read as a call on where conditions go next. The narrower claim is enough. Any model calibrated on the borrower population of 2015 through 2019 encodes a default rate that no longer holds, and it will underprice current files without signalling that it is doing so. Recalibration is required either way. The question is who does it, and how soon.
Both paths can produce a defensible small business credit risk model. Only one of them produces it before the current cohort finishes seasoning.
See the evidence against a real portfolio. The conventional validation results are published in full, including AUC by origination year and default concentration by risk decile, with a designed PDF of the same report available here. Lumos will also retro-score a lender's own historical originations and declined applications, which shows what a purchased model would have caught and what it would have approved, using that lender's data rather than ours. Request a portfolio retro-score.
Frequently Asked Questions
What is a small business credit risk model?
A small business credit risk model is a statistical model that estimates the likelihood a small business borrower will fail to repay, and the loss the lender would absorb if that happened, using loan characteristics, borrower financials, and economic conditions. Its outputs typically include a probability of default, a loss given default, and an expected loss figure that converts credit risk into dollars.
What is the difference between PD, LGD, and expected loss?
Probability of default is the chance a loan fails to perform over a stated horizon. Loss given default is the share of exposure the lender does not recover once default occurs. Expected loss is the product of the two multiplied by exposure, and it is the figure used for pricing and reserving.
How should a lender evaluate a small business credit risk model?
Three conditions carry most of the weight. Test out of time, holding out later origination years rather than scoring the model on the period it was fitted on. Account for seasoning, because recent vintages have not had time to fail and will make a lifetime model look weaker than it is. And check whether the model was scored on declined applications as well as approved ones, since an approved-only test cannot show whether the model would have caught what underwriting caught.
What AUC is good enough for a small business default prediction model?
Area under the curve measures how reliably a model ranks a defaulted loan above a performing one, where 0.5 is a coin flip and 1.0 is perfect. On small business credit, Lumos Prime+ reached approximately 0.70 on conventional business loans originated before 2023, which placed 35% of all defaults in the riskiest tenth of that seasoned book. Figures far above that range usually indicate a fully seasoned sample, inferred rather than observed outcomes, or a leak in the data rather than a better model.
How many defaults does a lender need to build its own credit risk model?
The constraint is default events rather than loan count. Conventional modeling practice calls for at least several hundred defaults spanning varied economic conditions, and preferably several thousand, which for most institutions represents many years of accumulated experience including a period of stress.
Is it better to build or buy a small business credit risk model?
Building suits lenders with large concentrated portfolios, in-house quantitative staff, and enough historical defaults across a full cycle to train on. Buying suits lenders who need cycle-tested data they have not personally accumulated, or who need a validated and documented model in weeks rather than years. Retrospective scoring of a lender's own originations and declines is the cheapest way to settle the question with evidence.
Does a credit risk model replace manual underwriting?
No. In the Lumos Prime+ validation across five conventional lenders, declined applications generally received the highest predicted default probabilities of any group, meaning the model agreed with underwriters rather than overruling them. The practical gain is consistency and turnaround time on files where judgment and the model concur, which frees underwriter attention for the files where they do not.
How often should a small business credit risk model be revalidated?
Interagency guidance was reissued as SR 26-2 in April 2026, which replaced a general expectation of annual revalidation with risk-based oversight tied to how material a model is to the institution. Revalidation should be triggered early when the borrower population shifts materially, which recent default trends in both conventional and SBA 7(a) lending indicate has occurred.
Book a 30-minute demo. No pressure, no sales pitch. Just a straightforward conversation about whether Lumos is right for you.
What To Expect:
Quick platform overview
Live demo with real loan examples
Discussion of your specific needs
Clear next steps
"The data and insights provided by Lumos have been instrumental in driving numerous policy changes within our organization."
VP, Senior Product Manager, US Bank

" height="29.26525980811059px" id="Eth71R0cp" transform="translate(50.52 7.877)" width="128.4356838868068px"/><path d="M 11.504 26.662 C 13.336 26.98 15.177 27.241 17.025 27.445 C 17.285 29.224 17.589 31.249 17.922 33.01 C 19.147 32.283 21.153 30.675 22.427 29.793 C 23.831 30.749 25.613 32.22 26.99 33.03 C 25.815 36.077 24.734 39.17 23.558 42.217 C 23.29 42.912 22.993 43.872 22.596 44.483 C 21.955 44.554 21.761 43.465 21.609 42.971 C 20.391 40.097 18.964 36.046 17.872 33.065 C 16.793 33.66 7.128 38.055 6.752 38.016 C 6.687 38.009 6.584 37.851 6.538 37.796 C 6.428 37.314 9.351 31.438 9.748 30.419 C 10.07 29.592 11.059 27.547 11.504 26.662 Z M 33.315 17.665 C 33.811 17.67 44.337 21.602 44.765 21.893 C 44.829 22.154 44.823 22.057 44.743 22.33 C 44.2 22.746 41.332 23.727 40.478 24.044 L 33.378 26.673 C 33.931 27.703 34.585 29.232 35.077 30.314 L 37.921 36.591 C 38.139 36.993 38.577 37.669 38.215 38.059 C 37.576 38.025 28.285 33.71 27.005 33.081 C 27.245 31.226 27.527 29.375 27.852 27.532 C 29.68 27.191 31.452 27.024 33.361 26.642 C 32.387 25.285 31.08 23.402 30.028 22.145 C 31.145 20.668 32.241 19.174 33.315 17.665 Z M 11.47 17.635 C 12.542 19.071 13.786 20.686 14.782 22.158 C 13.751 23.535 12.423 25.259 11.471 26.662 C 7.932 25.41 3.445 23.785 0 22.375 L 0 21.889 C 0.606 21.563 4.34 20.21 5.18 19.923 C 6.787 19.373 10.005 17.985 11.47 17.635 Z M 38.174 6.263 C 38.651 6.647 36.872 9.988 36.559 10.642 C 35.557 12.85 34.425 15.506 33.354 17.637 C 31.433 17.286 29.758 17.057 27.819 16.83 C 27.504 14.962 27.219 13.088 26.965 11.21 C 28.001 10.653 37.733 6.247 38.174 6.263 Z M 11.501 17.628 C 11.491 17.63 11.481 17.633 11.47 17.635 C 11.467 17.63 11.463 17.625 11.459 17.62 C 11.47 17.617 11.482 17.615 11.493 17.613 C 11.496 17.618 11.498 17.623 11.501 17.628 Z M 6.584 6.275 C 7.178 6.118 16.533 10.566 17.901 11.193 C 17.626 12.874 17.196 15.105 17.02 16.753 C 15.137 17.022 13.363 17.27 11.493 17.613 C 10.01 14.74 8.822 11.568 7.374 8.666 C 7.162 8.243 6.391 6.664 6.584 6.275 Z M 25.57 7.432 C 25.913 8.348 26.716 10.341 26.965 11.21 C 26.335 11.545 23.197 13.924 22.45 14.47 C 20.941 13.448 19.381 12.27 17.901 11.193 C 18.006 10.669 18.713 8.998 18.925 8.369 C 19.829 5.694 21.248 2.668 22.023 0 L 22.788 0 Z" fill="rgb(28, 26, 26)" height="44.486082377664px" id="u84SiQ2Nx" transform="translate(0 0.255)" width="44.80873390361835px"/></svg>)