
SBA 7(a) approvals dropped sharply against FY2025. But FY2025 was one of the most abnormal years the program has ever recorded. Measured against a fair benchmark, dollar volume is on trend, and the decline is far more specific than the headline suggests.
Key takeaways
Through the first nine months of FY2026, gross 7(a) approvals are down 33.4% by count and 20.9% by dollars versus FY2025, from 61,270 loans and $27.6B to 40,824 loans and $21.8B.
FY2025 was a record, inflated by real demand, a rush to close ahead of tighter June 2025 underwriting rules, and a 43-day shutdown that pulled FY2026 volume into September 2025.
Against FY2024, FY2026 dollar volume is up 2.3%, and closer to 10% higher after adjusting for the roughly $1.7B pulled into September 2025.
The decline is concentrated. Small loans under $500K and a pullback in originations by the largest lenders in FY2025 account for most of it.
Broad small-business loan demand did not collapse. The Fed's January 2026 SLOOS reported small-firm loan demand roughly unchanged, pointing to program and timing factors rather than a demand shock.
Every headline about SBA 7(a) lending in FY2026 leads with the same fact: approvals are down. Through the first nine months of the fiscal year, October 1 through June 30, gross 7(a) approvals fell 33.4% by count and 20.9% by dollars against the same window a year earlier. That is 61,270 loans and $27.6 billion in FY2025 falling to 40,824 loans and $21.8 billion in FY2026.
The decline is real. It is also the wrong comparison. FY2025 was not a normal year to measure against, and FY2026 did not begin on level footing. Look past the two distortions and the story changes from a shrinking program to something more useful for anyone planning FY2027: a program that is normalizing, and doing so unevenly.
All figures in this analysis are drawn from SBA 7(a) loan-level data in the Lumos Data Portal.
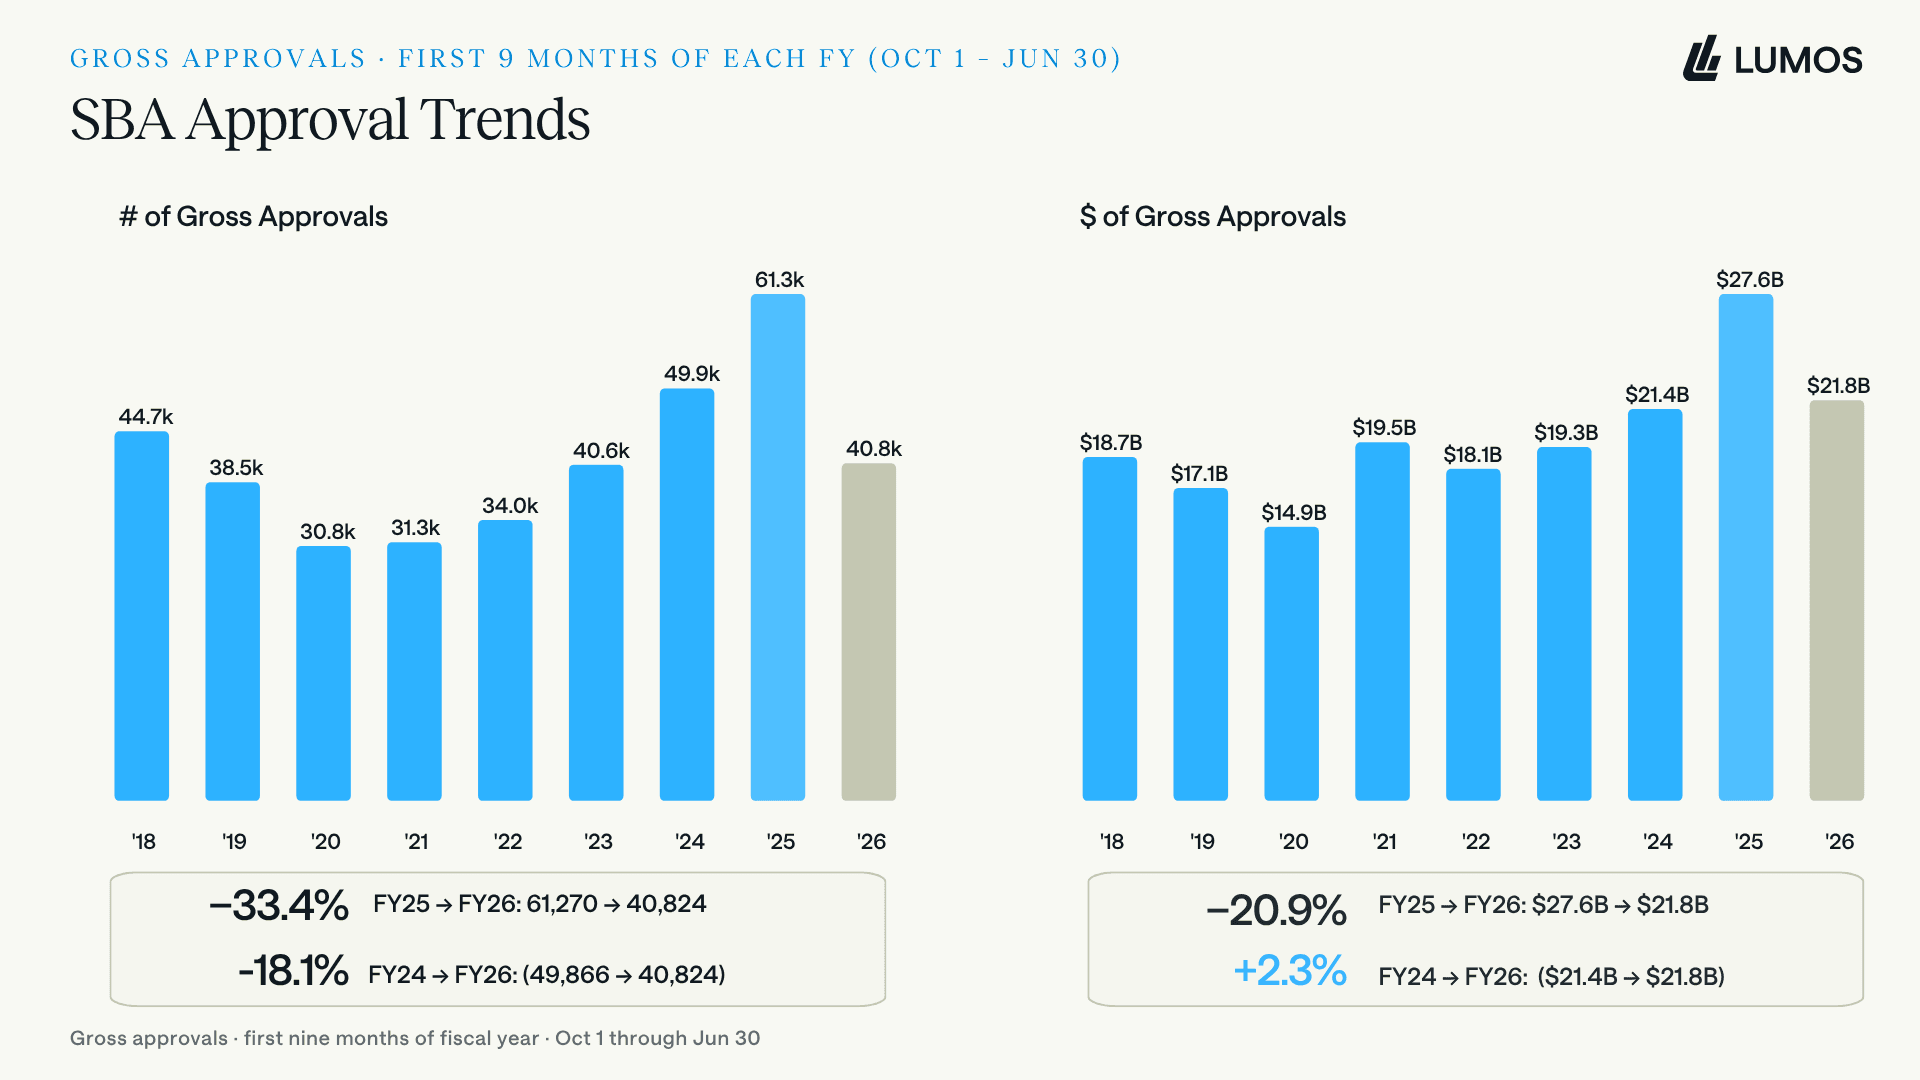
First-nine-months approvals, FY2018 to FY2026. FY2025 towers over every prior year, and FY2026 lands back in the pack. Against FY2025 the drop is steep, but FY2025 is the outlier. Measured against FY2024, count is down 18.1% while dollars are up 2.3%.
THE COMPARISON · FY25 TO FY26
Why FY2025 was never a fair benchmark
Two forces inflated FY2025. The first was genuine demand. The second was timing, and it cut in both directions.
The SBA's new origination guidance, SOP 50 10 8, took effect on June 1, 2025. It tightened underwriting across the board: a higher minimum SBSS score of 165, a lower streamlined threshold for small loans at $350,000, mandatory tax-transcript verification, and stricter eligibility. Lenders had every reason to close deals before the door narrowed, which pulled volume forward into the back half of FY2025.
Then, at the seam between the two fiscal years, the federal government shut down on October 1, 2025 and stayed closed for 43 days, the longest in history. The SBA suspended E-Tran and stopped issuing new 7(a) loan numbers. Lenders who saw it coming rushed approvals into September 2025, the final month of FY2025. Everyone else lost roughly six weeks of originations from the very start of the FY2026 window.
The September rush is visible in the data. September 2025 approvals totaled $4.6 billion. The historical average for September, covering 2016 through 2024 and excluding the 2020 and 2021 stimulus years, was $2.9 billion. September 2025 ran 56% above that adjusted average, which implies roughly $1.7 billion of volume pulled forward, much of it out of what would have been early FY2026.
So FY2025 borrowed volume from FY2026 at both ends, and FY2026 opened with the lights off.
DOLLAR APPROVALS · THE LONG ARC
On trend, not in freefall
Pull the camera back and the FY2025 spike is the anomaly, not the FY2026 bar. Nine-month dollar approvals have more than doubled since 2010, and FY2026 sits essentially on the decade-long trendline.
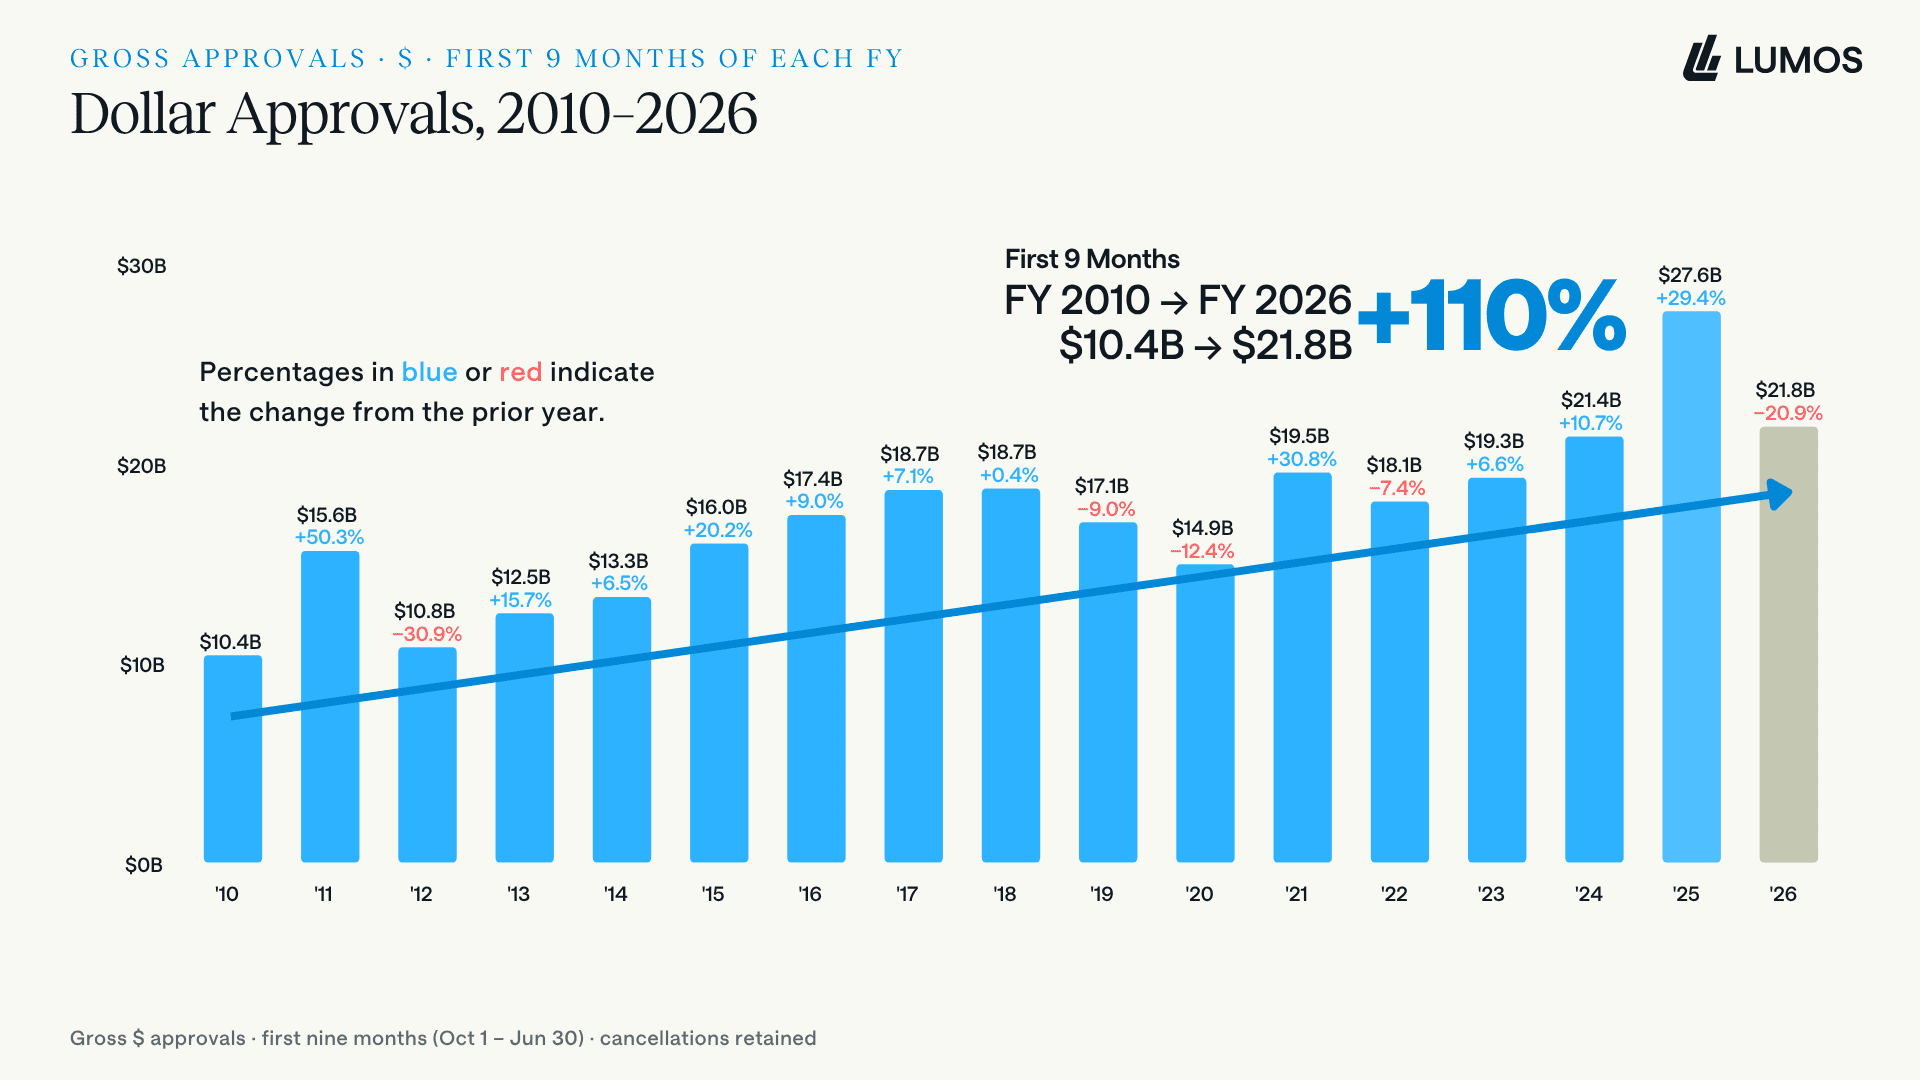
Nine-month dollar approvals, 2010 to 2026: up 110% across the period. FY2026's $21.8 billion falls on the trajectory the program has followed for a decade. The genuine outlier is FY2025 at $27.6 billion.
Against FY2024, arguably the last representative year before the surge, FY2026 dollar volume is up 2.3%, from $21.4 billion to $21.8 billion. Add back the roughly $1.7 billion pulled into September 2025 and underlying FY2026 activity runs closer to $23.5 billion, or about 10% above FY2024. Measured against the trend rather than the peak, there is no dollar decline. There is a give-back of an unsustainable spike.
MACRO CHECK · DEMAND VS. PROGRAM
Is this a demand problem, or an SBA problem?
A fair question follows: is the pullback in SBA-backed lending part of a broader retreat in small-business borrowing, or is it specific to the 7(a) program?
The evidence points to the program, not the market. In the Federal Reserve's January 2026 Senior Loan Officer Opinion Survey, which covers the fourth quarter of 2025, banks reported that demand for commercial and industrial loans from small firms was basically unchanged on net, even as demand from larger firms strengthened. The April 2026 survey, covering the first quarter of 2026, again reported demand for those loans across firms of all sizes as basically unchanged. Banks did keep credit standards tight, and they expect some deterioration in small-business loan quality in 2026, so the backdrop is cautious. But cautious is not collapsing, and flat demand does not explain a 33% drop in 7(a) approvals.
Two independent readings line up here. Total 7(a) dollar volume is on its decade trend, and broad small-business loan demand is roughly flat. Both suggest the 7(a) decline is driven by program changes, the shutdown, and the pull-forward, rather than by a small-business economy that stopped borrowing.
Source: Federal Reserve Senior Loan Officer Opinion Survey, January 2026 and April 2026.
CONCENTRATION · WHO PULLED BACK
The decline is concentrated at the top
The pullback is not spread evenly. The largest originators drove most of it.
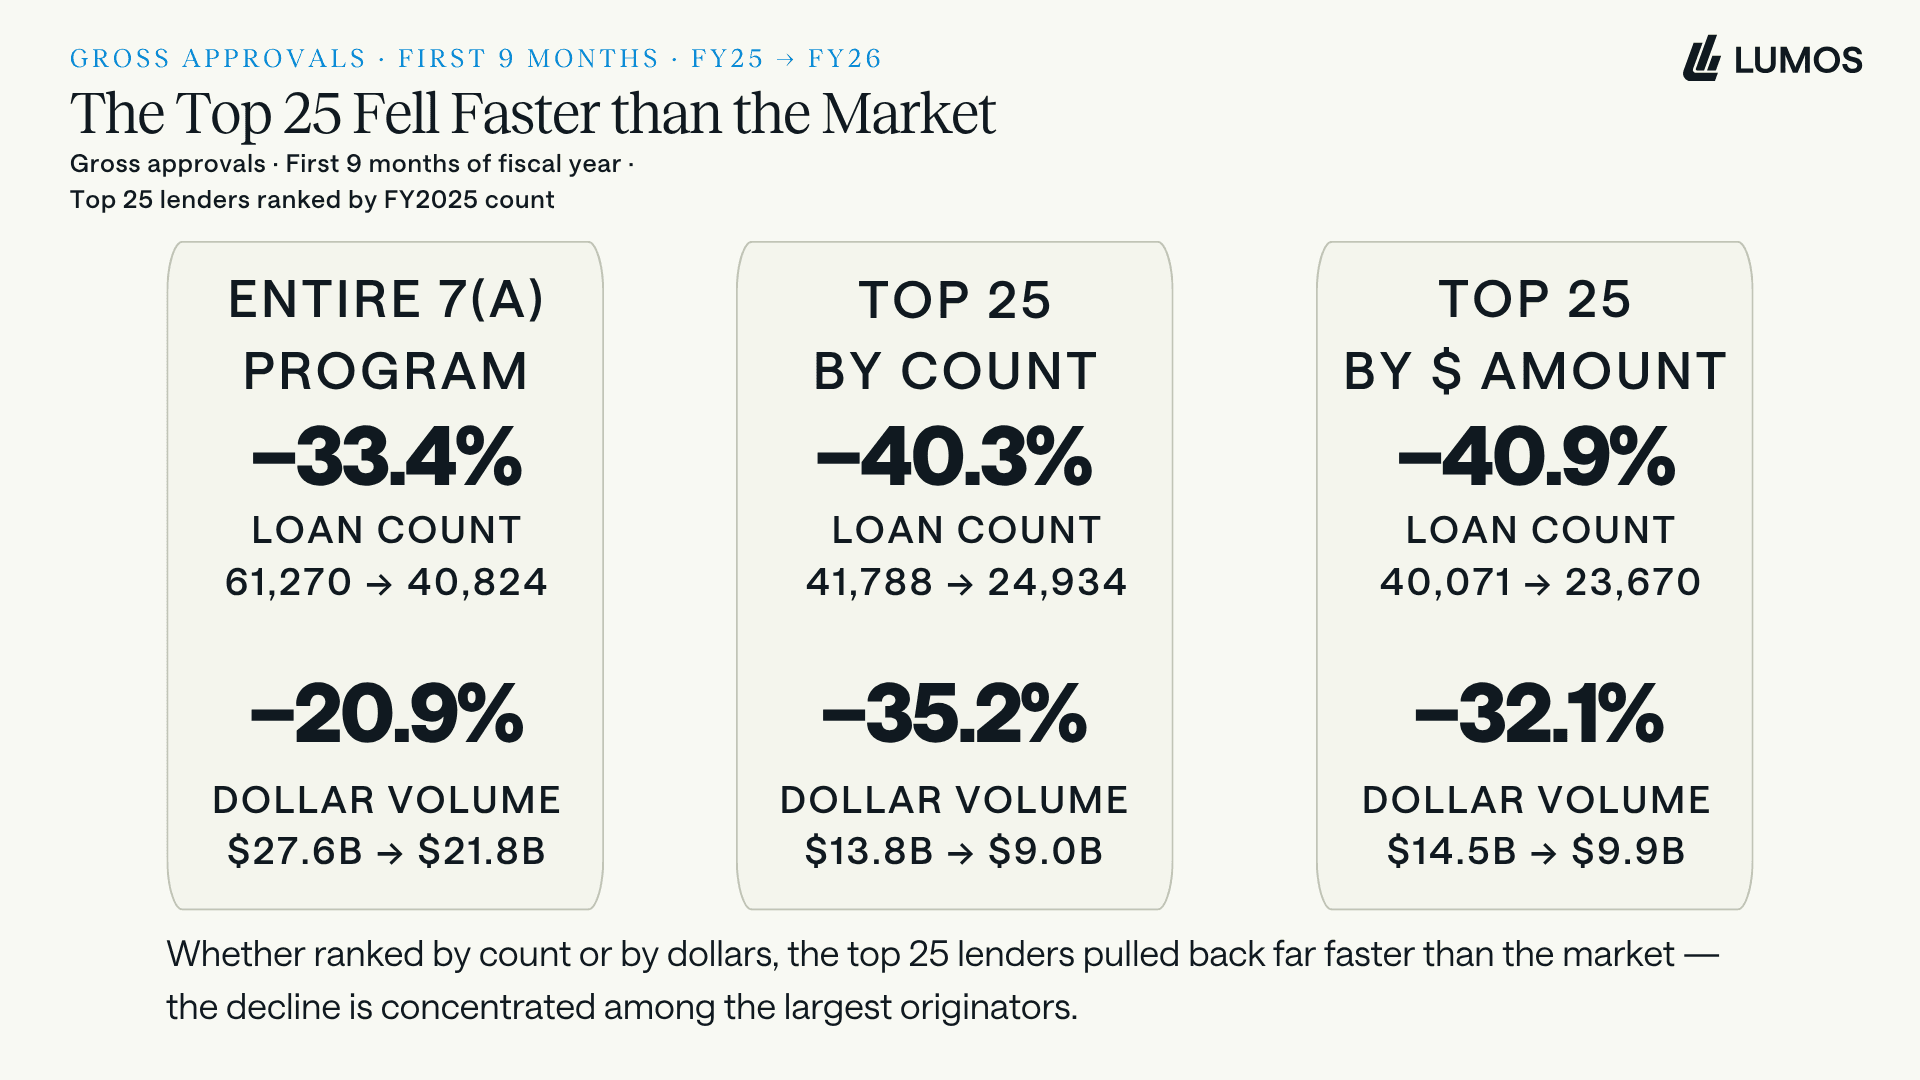
The whole program fell 33.4% by count. The top 25 lenders fell roughly 40%, whether ranked by count or by dollars. The contraction is concentrated among the largest players.
The dispersion within that group is wide. Among the 25 highest-volume lenders, nearly all cut back, several by more than half, and only a handful grew. One large originator is down more than 90% year over year while a few others posted double-digit gains. That spread points to individual balance-sheet considerations and strategic decisions rather than a uniform market retreat. For community and mid-tier lenders, the top-heavy shape of the decline is the opportunity, because the biggest players are stepping back from exactly the segments a nimbler shop can serve.
LOAN SIZE · WHERE THE VOLUME WENT
Small loans did most of the damage
The count decline and the dollar decline are not the same story. Split approvals by size and the pattern is clear.
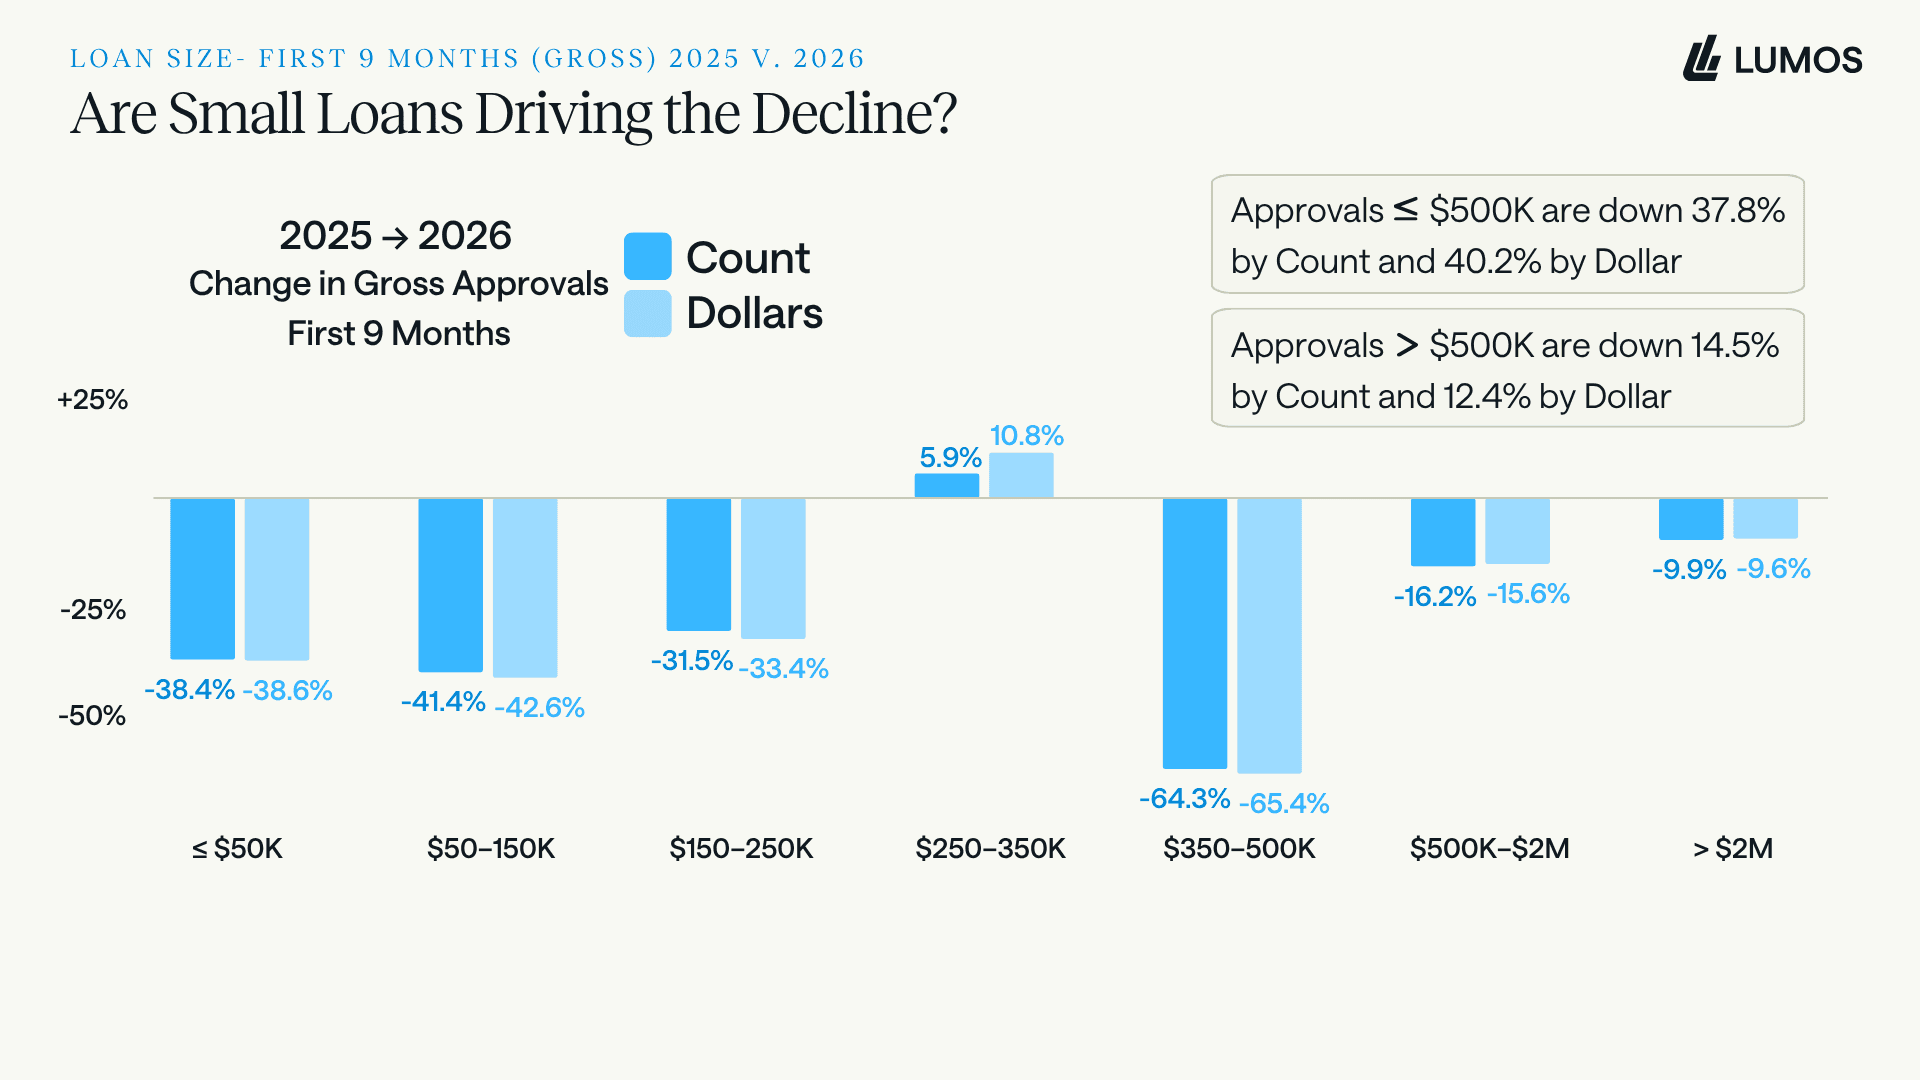
Change by size band. Approvals of $500K or less fell about 38% by count, while approvals above $500K fell about 15%. The drop in the number of businesses served is overwhelmingly a small-loan story.
THE POLICY FINGERPRINT
The $350,000 to $500,000 band fell hardest of all, down 64%. That is precisely the range the June 2025 SOP pushed out of streamlined processing and into full underwriting when it lowered the small-loan threshold from $500,000 to $350,000. The rule change is visible in the data.
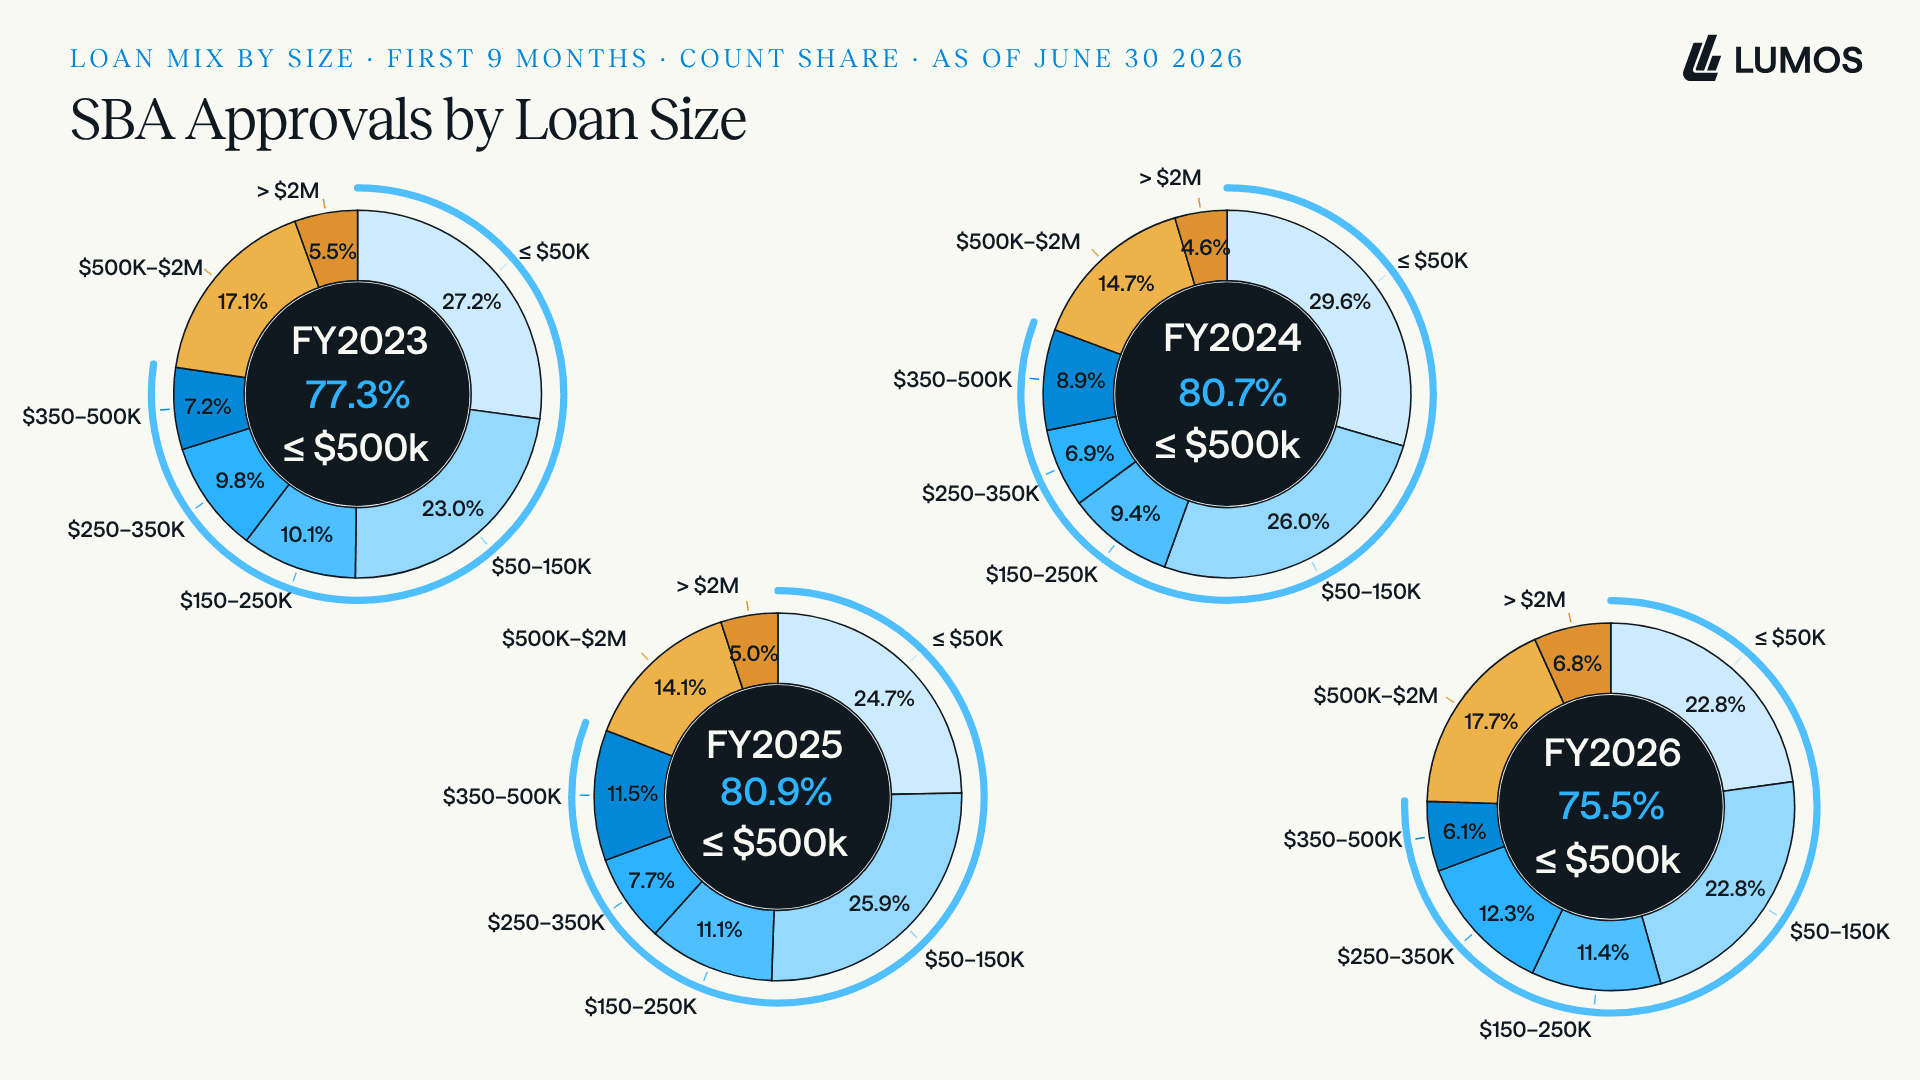
Count mix by size. The share of loans of $500K or less slipped from 80.9% in FY2025 to 75.5% in FY2026 as the book tilted toward larger deals.
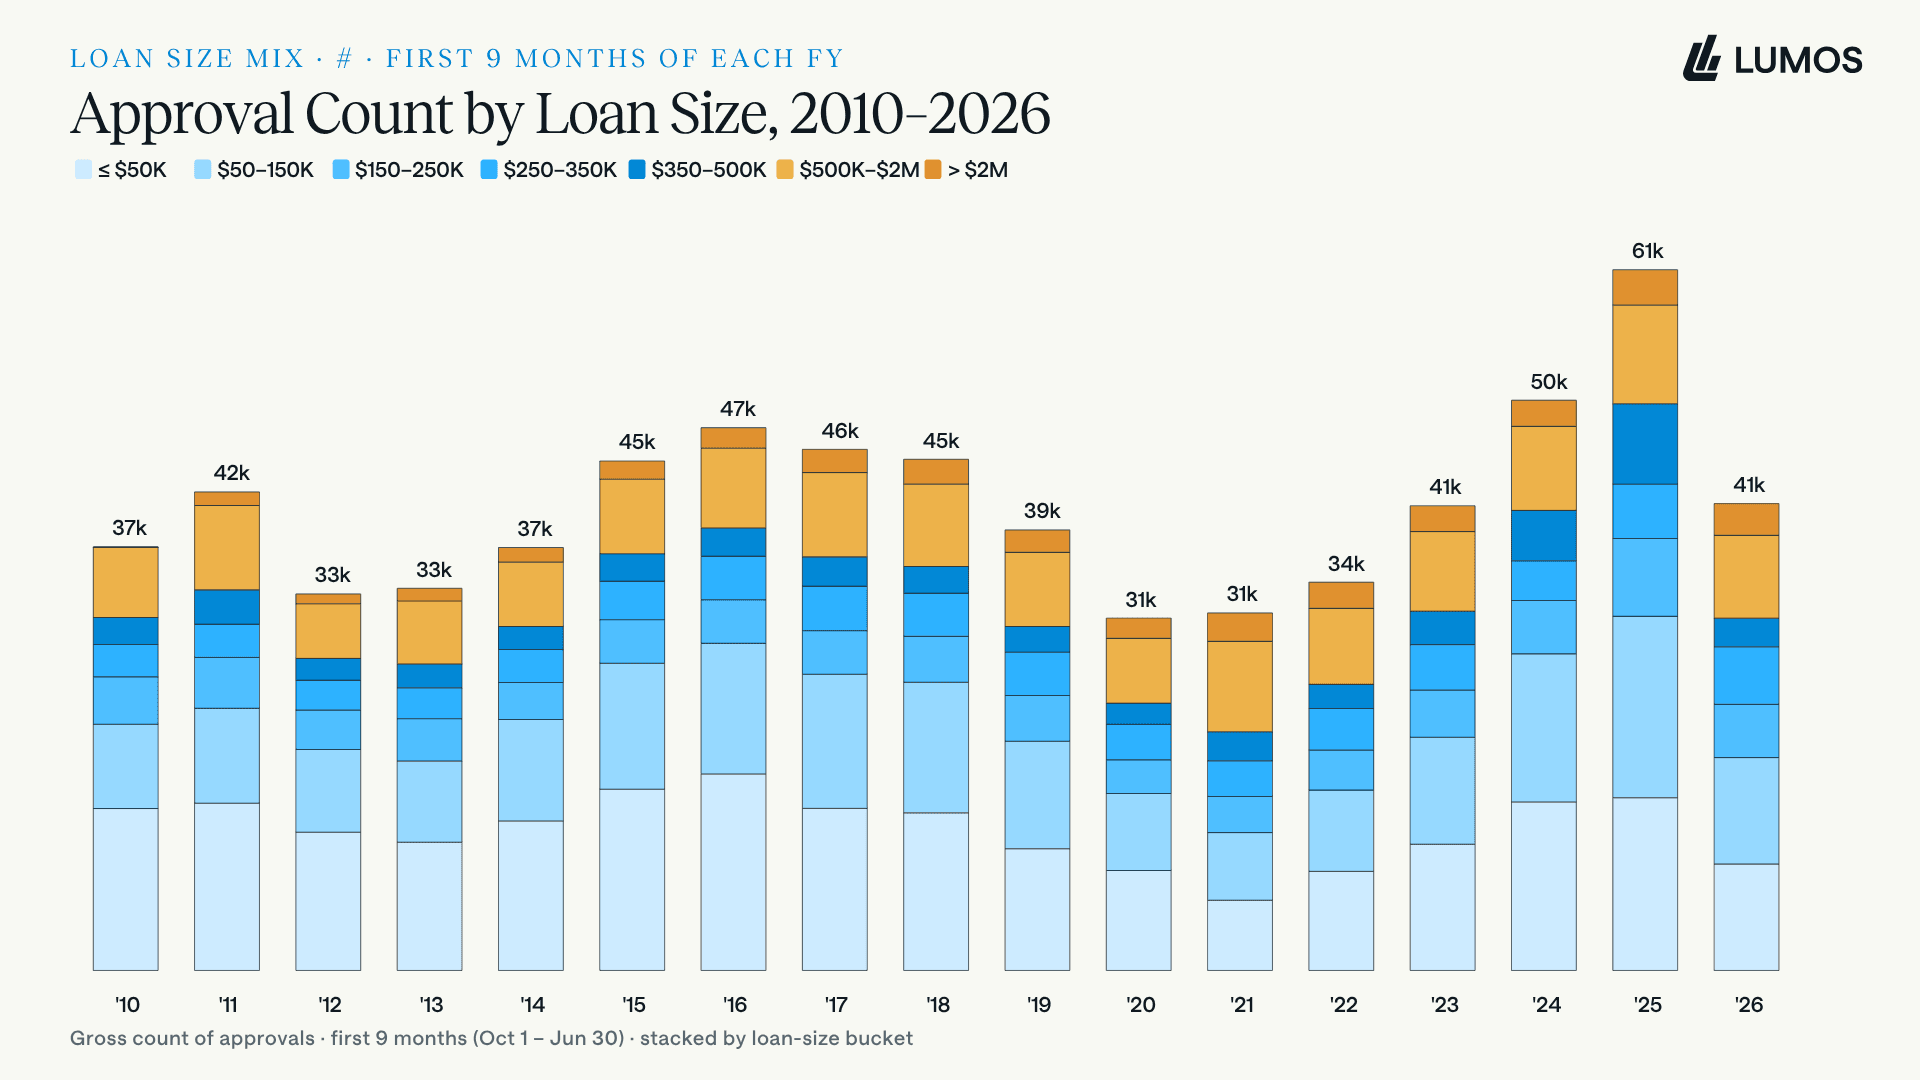
Count by size band, 2010 to 2026. The FY2025 bulge was disproportionately small-dollar lending. Strip those out and FY2026 resembles FY2022 and FY2023.
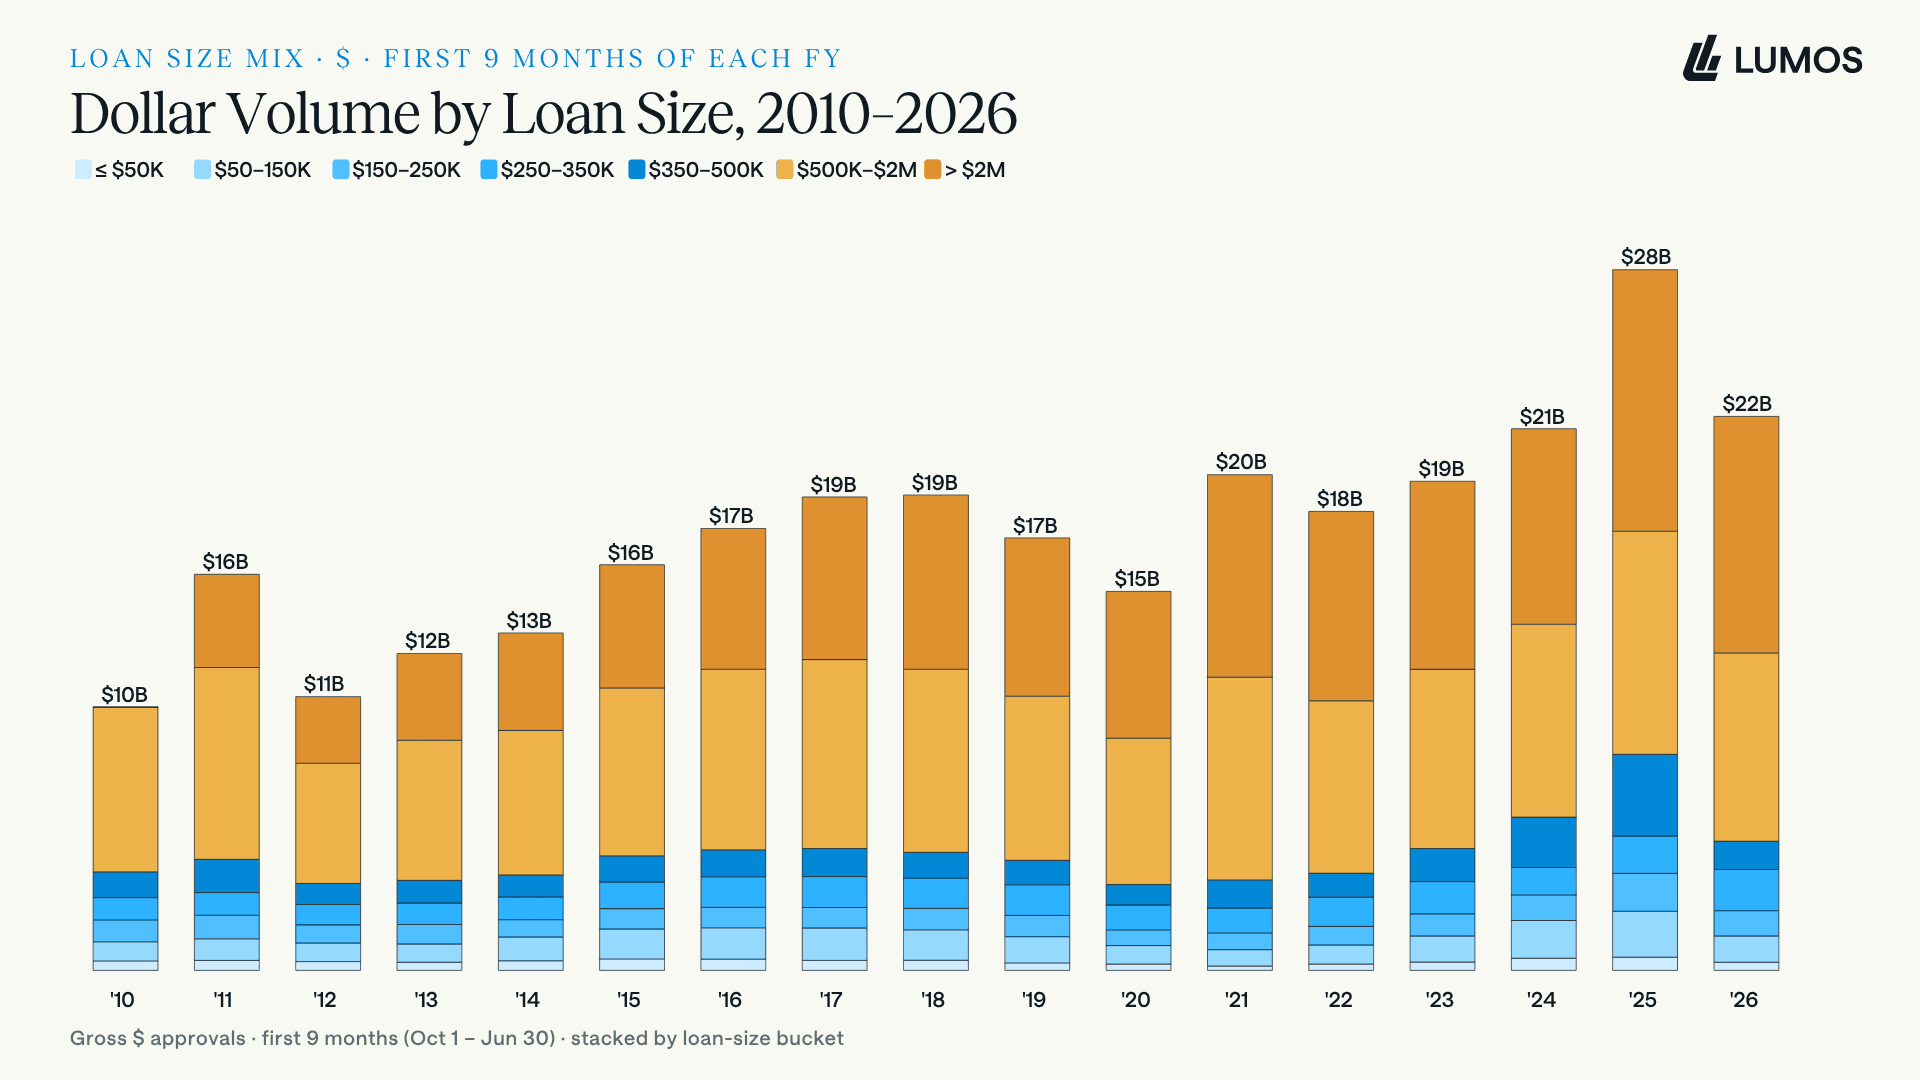
Dollar volume by size band. Because large loans carry the dollars, total volume held up far better than loan count. That is why a 21% dollar decline understates a much larger drop in the number of businesses reached.
GEOGRAPHY · NO SAFE HARBOR
Broad-based across the map
If the decline were regional, it would be easier to explain. It is not.
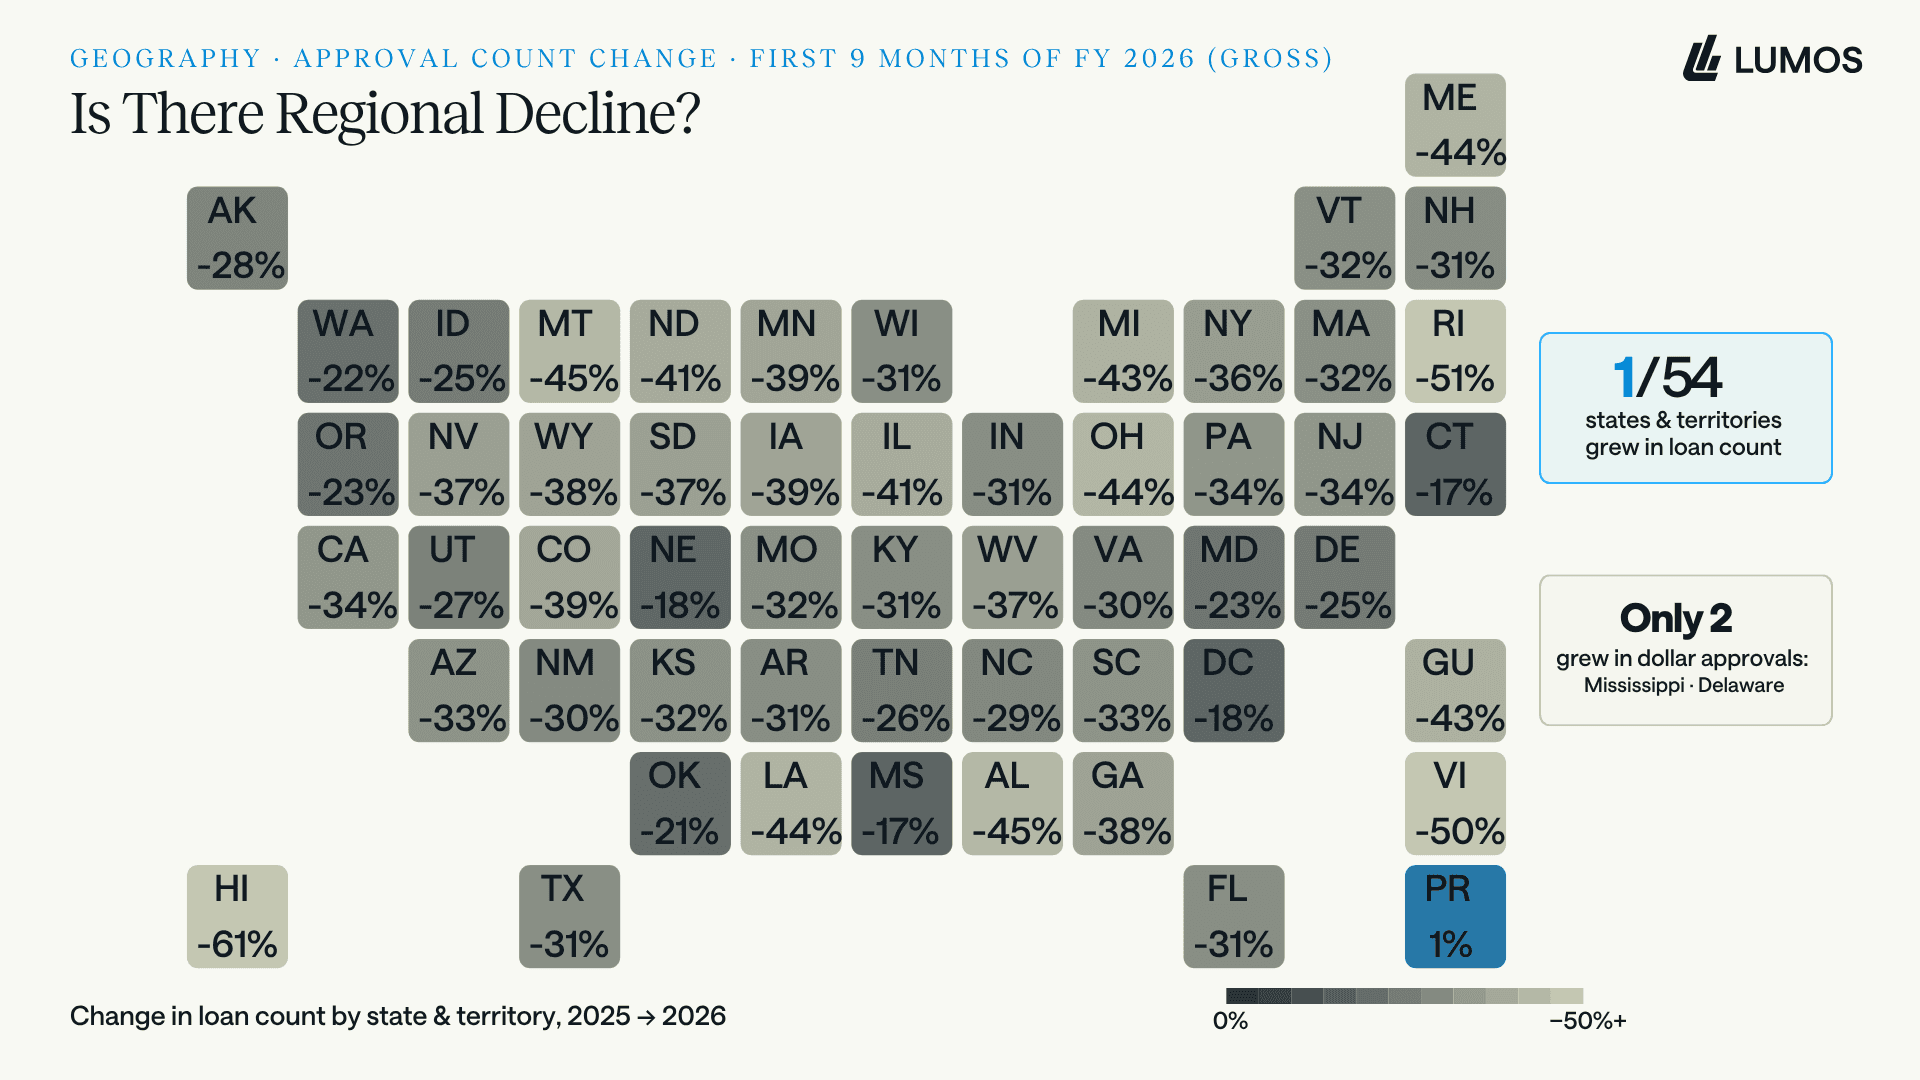
Loan-count change by state. 53 of 54 states and territories declined. Only Puerto Rico grew.

By dollars, exactly two grew: Mississippi at 13% and Delaware at 11%. Everywhere else contracted.
INDUSTRY · EVERY SECTOR DOWN
And across the whole economy
The same breadth shows up by industry. The driver of a decline for FY2026 is not sector-specific.
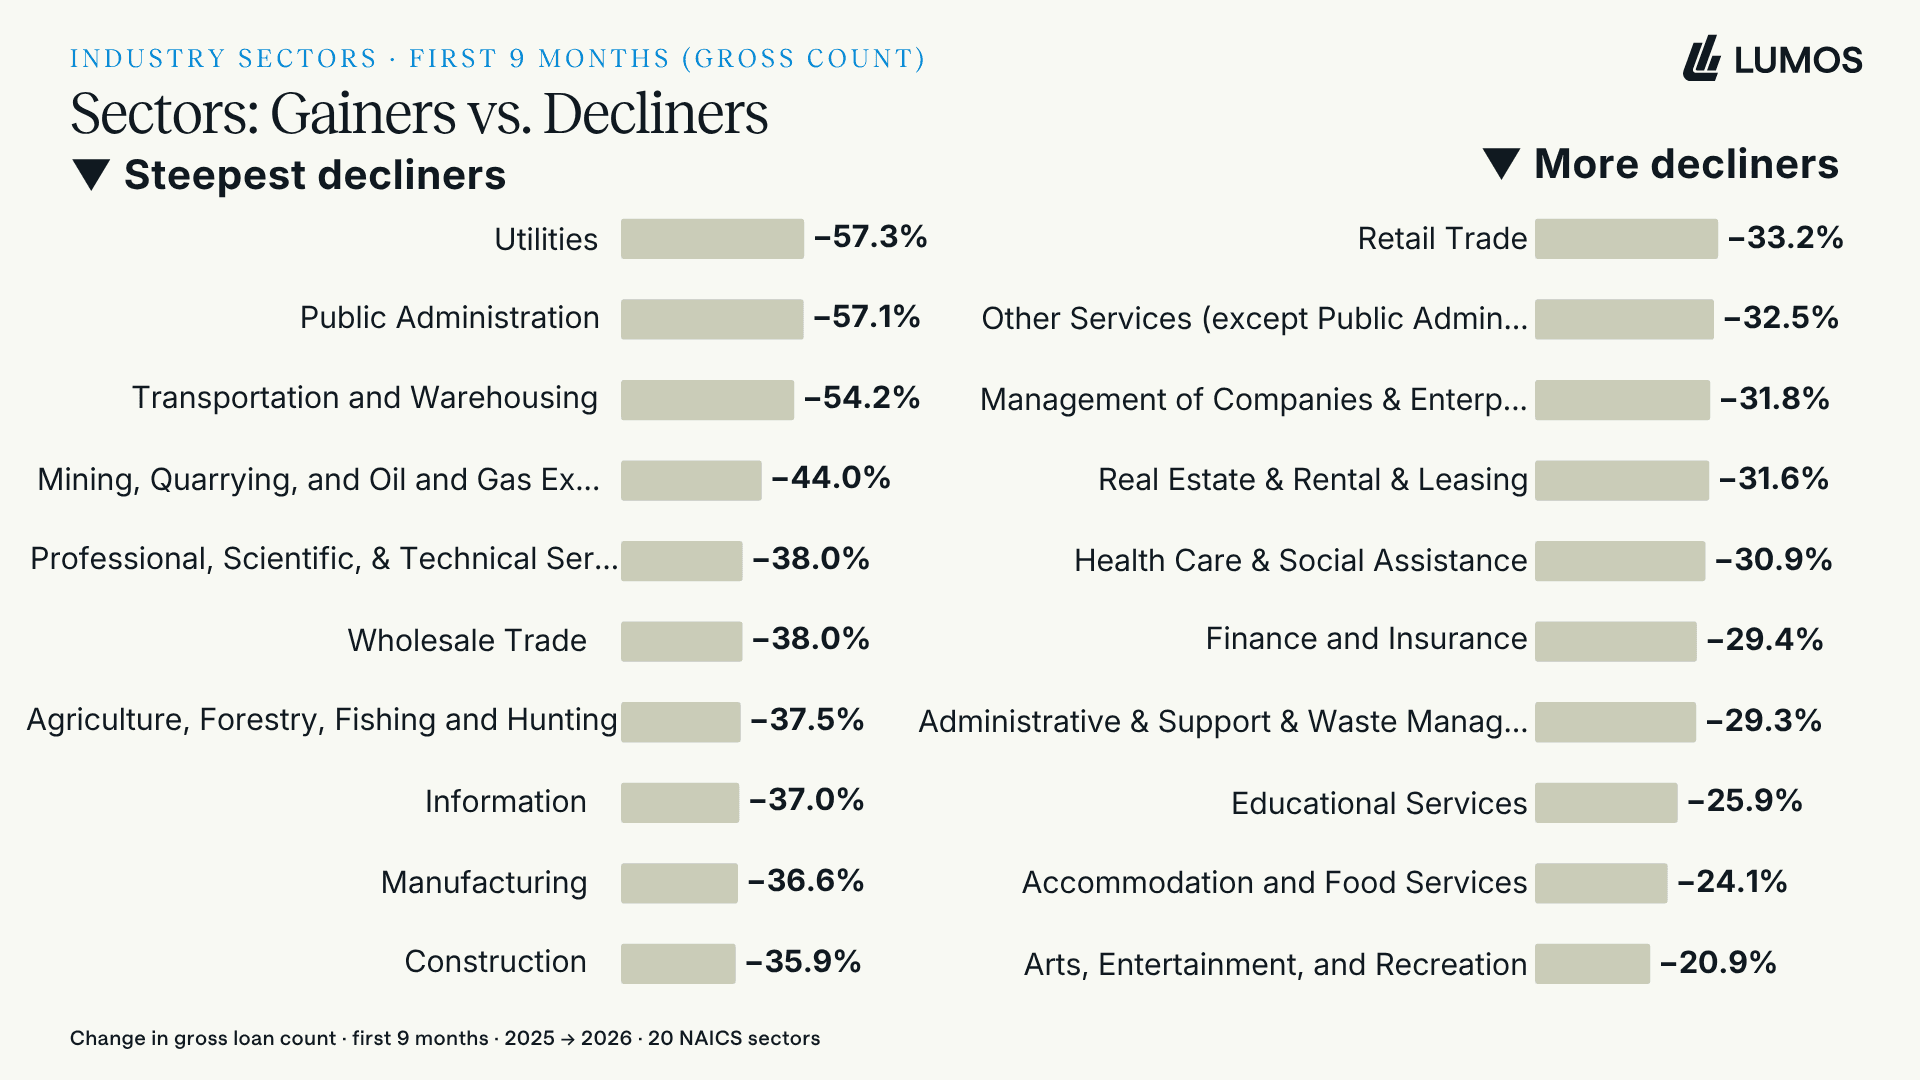
All 20 NAICS sectors declined by count, from Utilities at down 57% to Arts and Recreation at down 21%. No corner of the economy was spared.
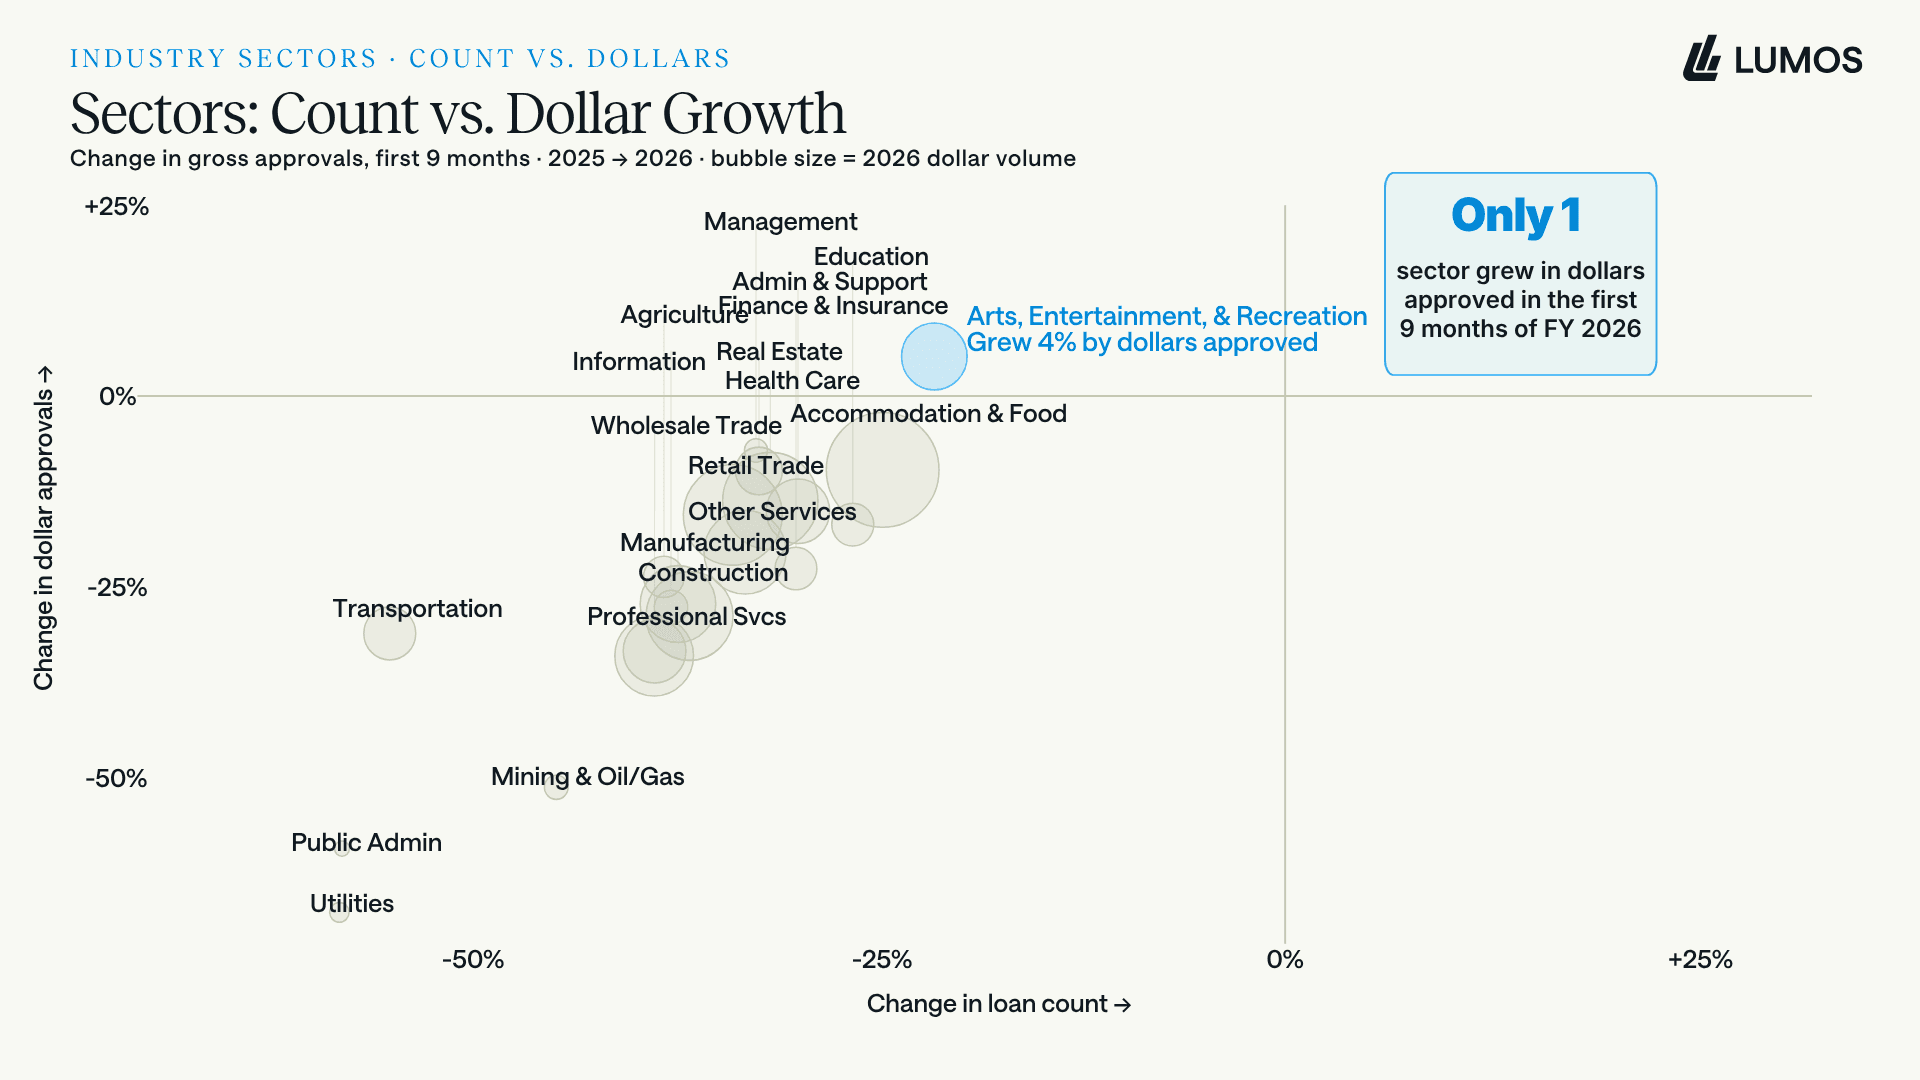
The same sectors on two axes, count against dollars. Only one sector, Arts, Entertainment, and Recreation, grew in dollars approved, and even then by just 4%. The breadth points back to program-level factors rather than any single industry's cycle.
FRANCHISE · THE OUTLIER
The one place lending grew
Against a market that fell almost everywhere, franchise lending is the exception. Franchise figures below are net approvals for the first six months of each year.
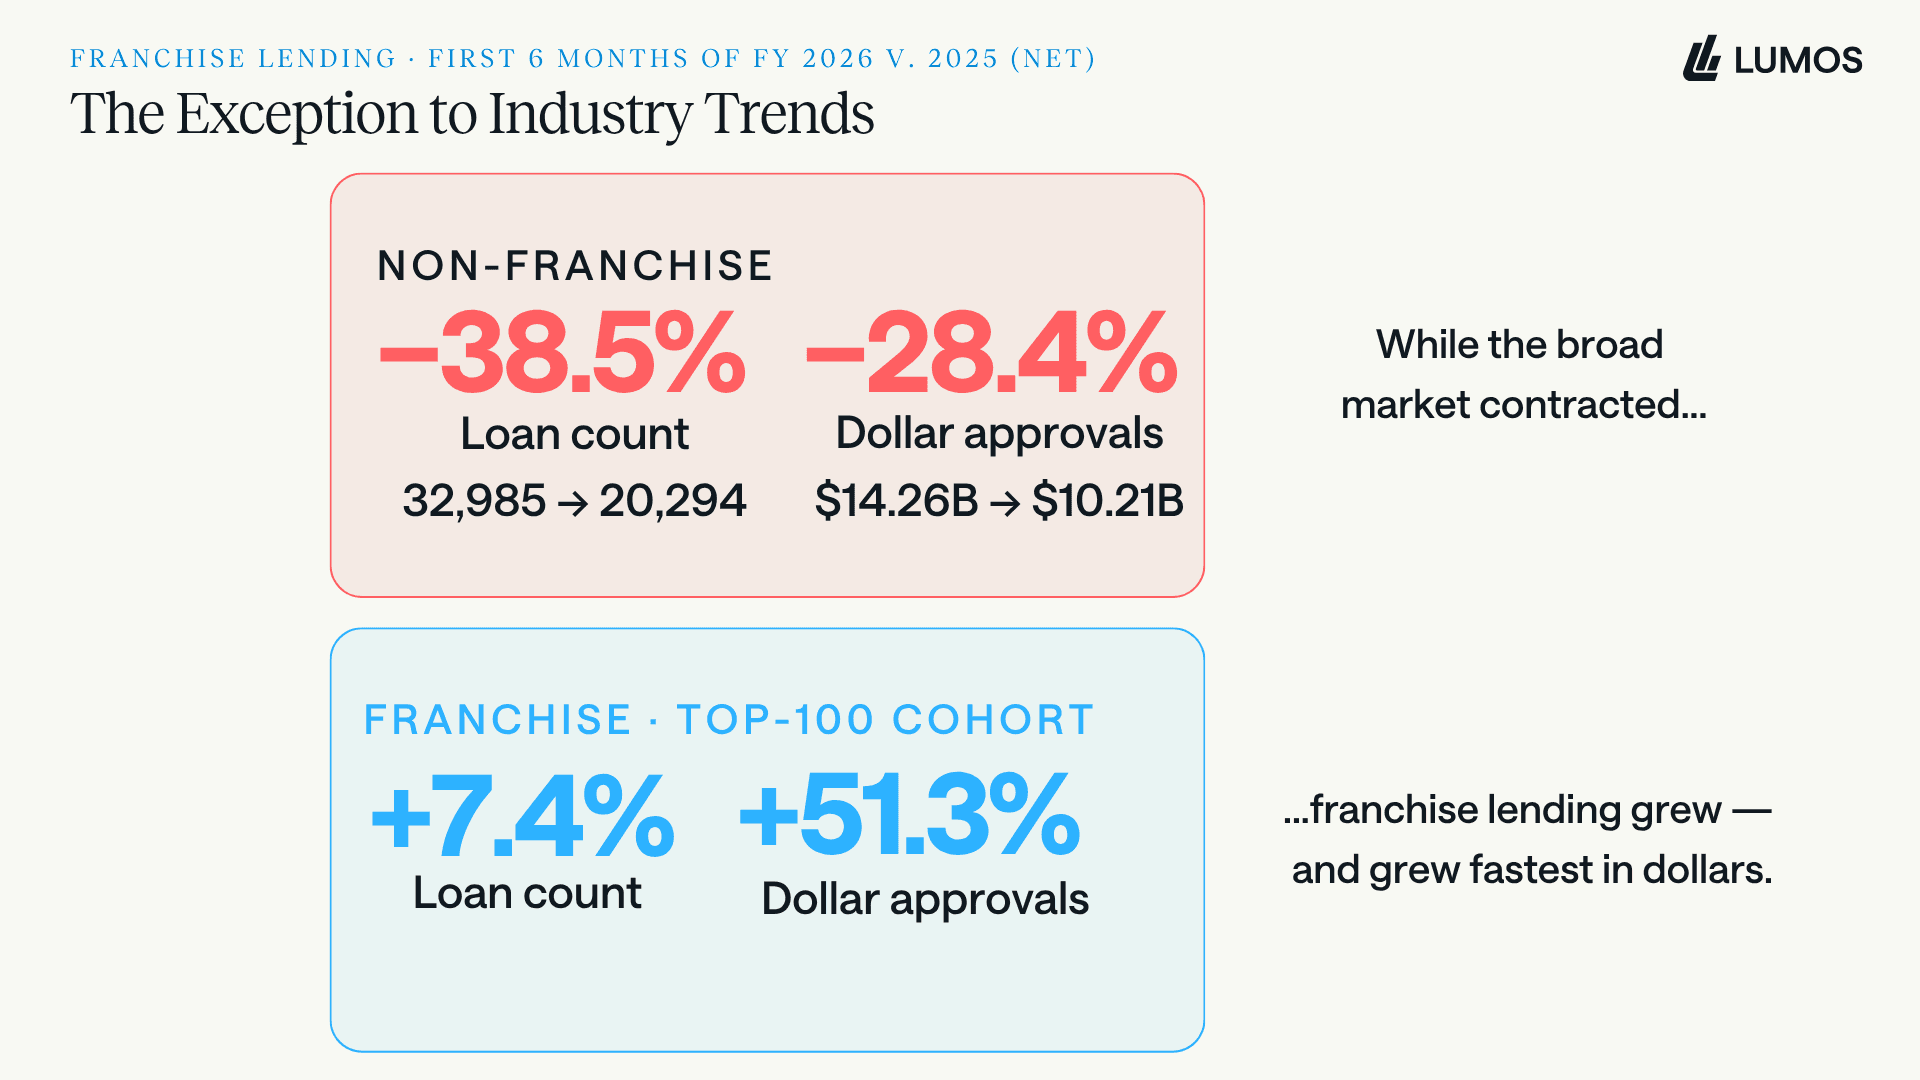
The top-100 franchise cohort grew 7.4% by count and 51.3% by dollars, while non-franchise lending fell 38.5% by count. Franchise did not just outperform. It moved the opposite direction.
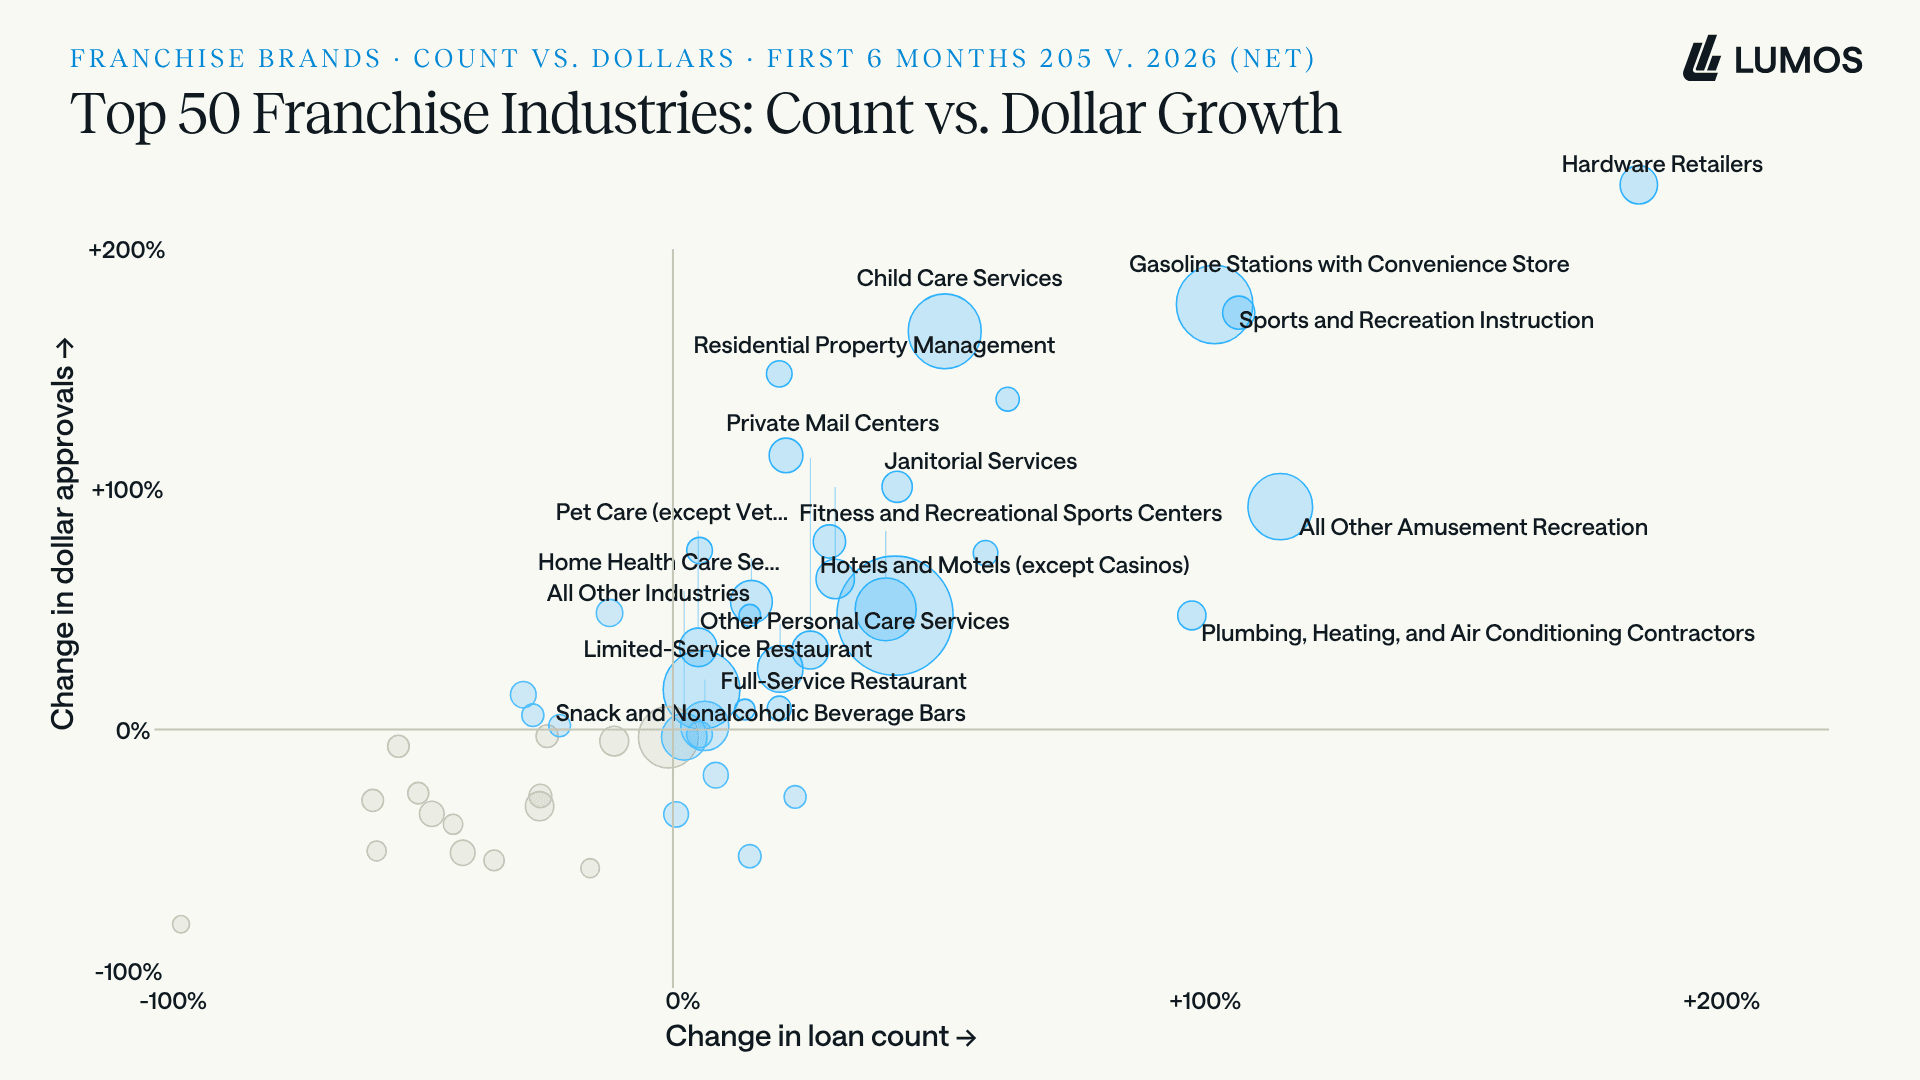
Count against dollar growth across the top franchise industries. Hardware retail, convenience-store fuel, child care, and recreation instruction cluster in the high-growth quadrant.
For lenders, the takeaway is concrete. Registered, directory-listed brands with predictable unit economics are where the growth is, and the tighter SOP rewards exactly the kind of standardized, well-documented deals that franchise lending produces.
PARTICIPATION · WHO'S STILL LENDING
Fewer players, flatter concentration
Underneath the volume story is a slower structural one.
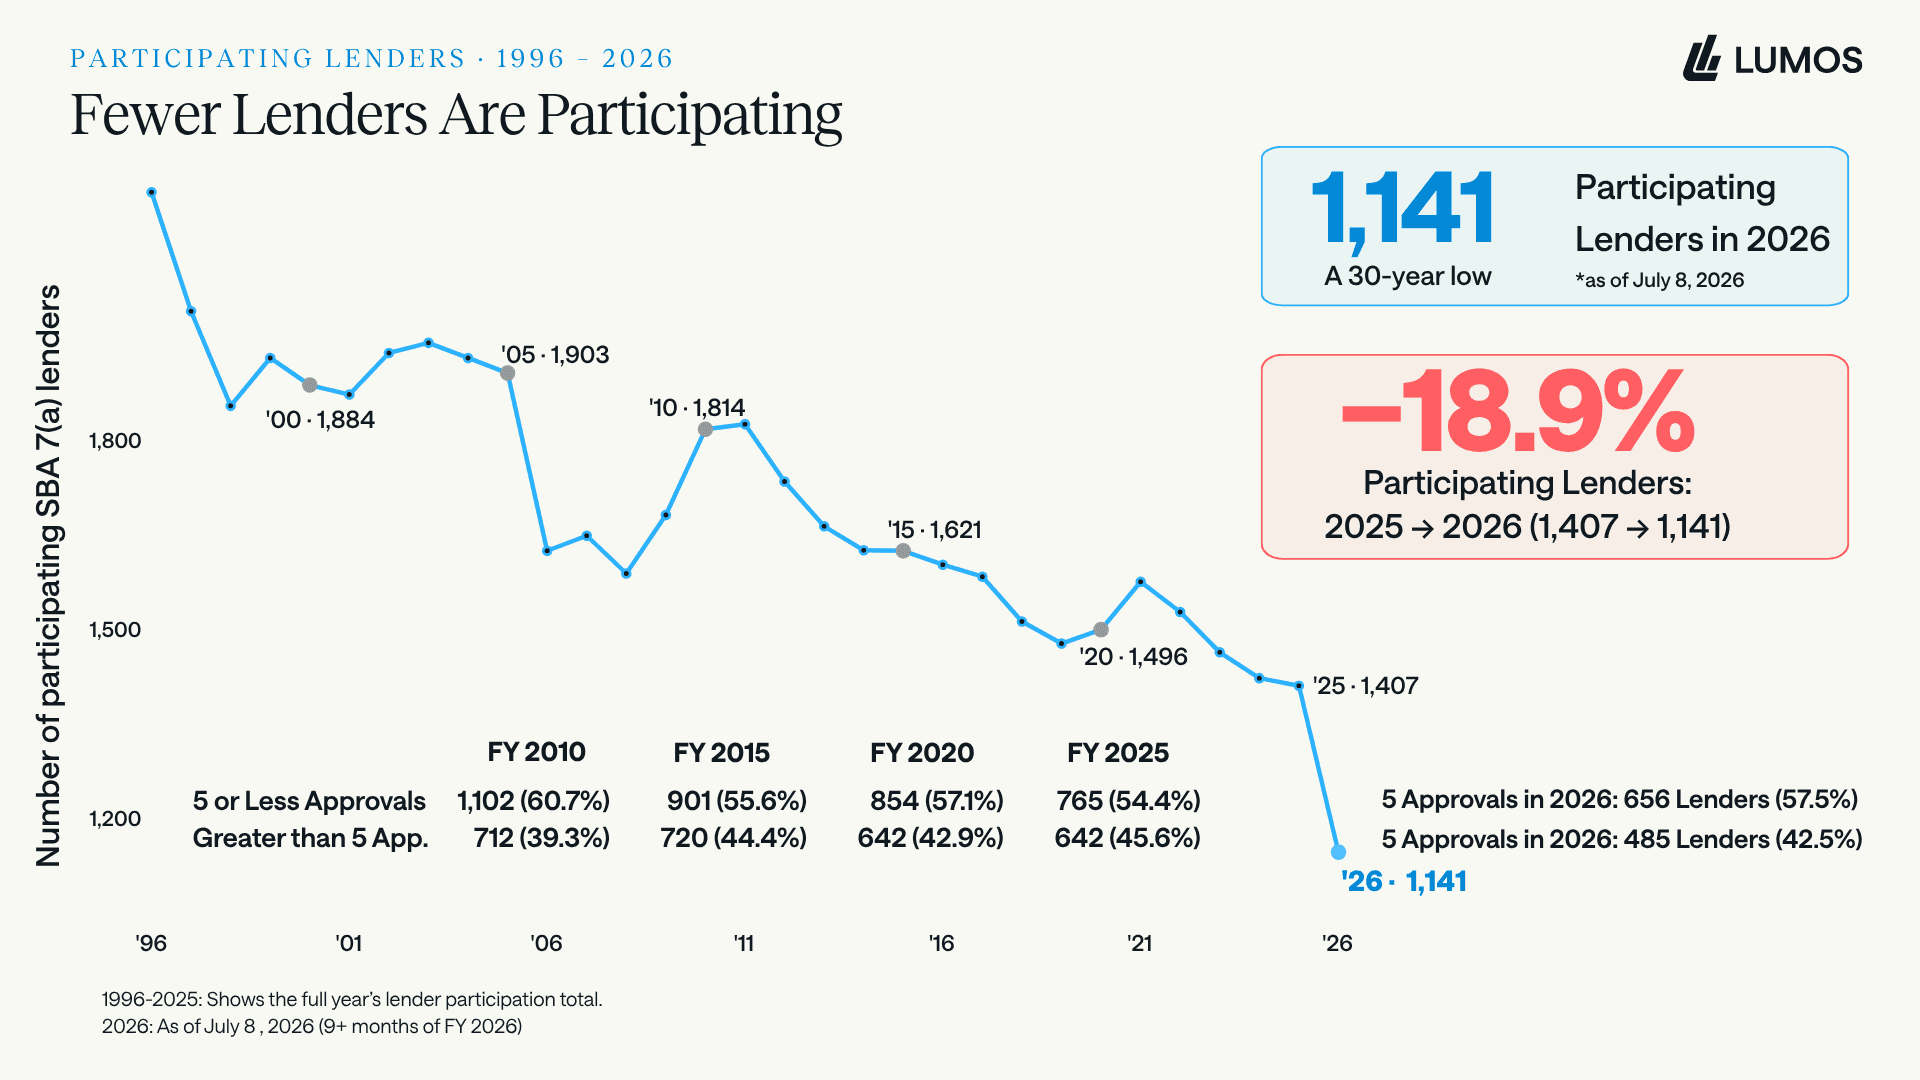
Participating 7(a) lenders fell to 1,141, a 30-year low, down 18.9% year over year. More than half now make five or fewer loans a year.

Concentration is falling, not rising. The top 10's share of dollars is 30.3%, down from 42.6% in 1996. The program has consolidated in participation while dispersing in share.
THE TAKEAWAY
A benchmark that broke, not a market that did
The honest read of FY2026 is not that SBA lending is collapsing. An unsustainable FY2025 peak, lifted by real demand, a pull-forward ahead of tighter rules, and a shutdown that shoved volume across the fiscal-year line, has normalized. Dollar volume is on trend. Broad small-business demand is roughly flat. The count decline concentrates in small loans and among the largest originators. Franchise lending is expanding. And the field of active lenders is thinning even as its dollars disperse.
If FY2025 was the number behind your FY2026 plan, the miss is not a market that broke. It is a benchmark that was never going to hold. The lenders positioned to gain from here are the ones reading the composition, not the headline.
While understanding approval volumes is critical for strategy, lenders must also keep a close eye on portfolio health. Read our complete breakdowns of FY2026 SBA 7(a) default rates and SBA 7(a) prepayment speeds to see how portfolio performance is trending. Sector-level performance across all nineteen NAICS groupings is set out in our industry benchmark.
About this analysis
Visualizations and analyses included in this report were built from SBA 7(a) loan-level data in the Lumos Data Portal, which holds more than 2 million SBA loans and 30 years of performance history. Subscribers can run data cuts themselves by lender, industry, geography, loan size, or vintage.
The same analytics can be pointed at a single institution's book rather than the whole market. Lumos Portfolio Insights applies them to small business portfolios, SBA and non-SBA, with a predictive credit risk focus: probability of default, loss given default, and expected loss at the loan level, plus risk migration as conditions change.
FAQ: SBA 7(a) performance, answered
Is SBA 7(a) lending declining in 2026?
Against FY2025 it is, with first-nine-month approvals down 33.4% by count and 20.9% by dollars. But FY2025 was a record year. Measured against FY2024, FY2026 dollar volume is up 2.3%, and closer to 10% higher after adjusting for volume pulled into September 2025 ahead of the government shutdown.
Why did SBA 7(a) loan volume drop in FY2026?
Three factors: a 43-day government shutdown that froze new approvals in October and November 2025, tighter underwriting under SOP 50 10 8 (effective June 2025), and a comparison against an inflated FY2025 base that had pulled volume forward. Broad small-business loan demand stayed roughly flat over the same period, so the drop is largely program and timing driven.
How did the 2025 government shutdown affect SBA loans?
From October 1, 2025, the SBA suspended E-Tran and stopped issuing new 7(a) loan numbers for 43 days. New approvals were effectively frozen, and lenders rushed to close deals in September 2025, which added roughly $1.7 billion of pulled-forward volume to the final month of FY2025.
Which loans drove the SBA 7(a) decline?
Small loans. Approvals of $500K or less fell about 38% by count versus about 15% for larger loans. The $350K to $500K band fell hardest, down 64%, aligning with the SOP change that moved that range out of streamlined processing.
How many lenders participate in the SBA 7(a) program?
As of July 2026, 1,141 lenders were participating, a 30-year low and down 18.9% from 1,407 a year earlier. More than half made five or fewer loans.
Is the SBA pullback caused by weak small-business demand?
Largely no. The Federal Reserve's January and April 2026 Senior Loan Officer Opinion Surveys reported small-firm loan demand as basically unchanged. Total 7(a) dollar volume is also on its decade-long trend. Both point to program changes, the shutdown, and the FY2025 pull-forward rather than a demand collapse.
Do you have other questions you would like to discuss?
Notes & Sources
Window. Unless stated otherwise, figures cover the first nine months of each fiscal year, October 1 through June 30, and reflect gross approvals. Franchise figures cover the first six months and are shown on a net basis. FY2026 data runs through early July 2026.
Policy context. SOP 50 10 8 took effect June 1, 2025 (higher minimum SBSS of 165, small-loan threshold lowered to $350,000, added verification and eligibility rules). The FY2026 window opened with a 43-day federal government shutdown, October 1 to mid-November 2025, that suspended new 7(a) approvals. Revised ownership and citizenship requirements took effect in early 2026.
Demand context. Federal Reserve Senior Loan Officer Opinion Survey, January 2026 (Q4 2025) and April 2026 (Q1 2026).
Data. SBA 7(a) loan-level data from the Lumos Data Portal. Analysis and charts by Lumos.
Book a 30-minute demo. No pressure, no sales pitch. Just a straightforward conversation about whether Lumos is right for you.
What To Expect:
Quick platform overview
Live demo with real loan examples
Discussion of your specific needs
Clear next steps
"The data and insights provided by Lumos have been instrumental in driving numerous policy changes within our organization."
VP, Senior Product Manager, US Bank

" height="29.26525980811059px" id="Eth71R0cp" transform="translate(50.52 7.877)" width="128.4356838868068px"/><path d="M 11.504 26.662 C 13.336 26.98 15.177 27.241 17.025 27.445 C 17.285 29.224 17.589 31.249 17.922 33.01 C 19.147 32.283 21.153 30.675 22.427 29.793 C 23.831 30.749 25.613 32.22 26.99 33.03 C 25.815 36.077 24.734 39.17 23.558 42.217 C 23.29 42.912 22.993 43.872 22.596 44.483 C 21.955 44.554 21.761 43.465 21.609 42.971 C 20.391 40.097 18.964 36.046 17.872 33.065 C 16.793 33.66 7.128 38.055 6.752 38.016 C 6.687 38.009 6.584 37.851 6.538 37.796 C 6.428 37.314 9.351 31.438 9.748 30.419 C 10.07 29.592 11.059 27.547 11.504 26.662 Z M 33.315 17.665 C 33.811 17.67 44.337 21.602 44.765 21.893 C 44.829 22.154 44.823 22.057 44.743 22.33 C 44.2 22.746 41.332 23.727 40.478 24.044 L 33.378 26.673 C 33.931 27.703 34.585 29.232 35.077 30.314 L 37.921 36.591 C 38.139 36.993 38.577 37.669 38.215 38.059 C 37.576 38.025 28.285 33.71 27.005 33.081 C 27.245 31.226 27.527 29.375 27.852 27.532 C 29.68 27.191 31.452 27.024 33.361 26.642 C 32.387 25.285 31.08 23.402 30.028 22.145 C 31.145 20.668 32.241 19.174 33.315 17.665 Z M 11.47 17.635 C 12.542 19.071 13.786 20.686 14.782 22.158 C 13.751 23.535 12.423 25.259 11.471 26.662 C 7.932 25.41 3.445 23.785 0 22.375 L 0 21.889 C 0.606 21.563 4.34 20.21 5.18 19.923 C 6.787 19.373 10.005 17.985 11.47 17.635 Z M 38.174 6.263 C 38.651 6.647 36.872 9.988 36.559 10.642 C 35.557 12.85 34.425 15.506 33.354 17.637 C 31.433 17.286 29.758 17.057 27.819 16.83 C 27.504 14.962 27.219 13.088 26.965 11.21 C 28.001 10.653 37.733 6.247 38.174 6.263 Z M 11.501 17.628 C 11.491 17.63 11.481 17.633 11.47 17.635 C 11.467 17.63 11.463 17.625 11.459 17.62 C 11.47 17.617 11.482 17.615 11.493 17.613 C 11.496 17.618 11.498 17.623 11.501 17.628 Z M 6.584 6.275 C 7.178 6.118 16.533 10.566 17.901 11.193 C 17.626 12.874 17.196 15.105 17.02 16.753 C 15.137 17.022 13.363 17.27 11.493 17.613 C 10.01 14.74 8.822 11.568 7.374 8.666 C 7.162 8.243 6.391 6.664 6.584 6.275 Z M 25.57 7.432 C 25.913 8.348 26.716 10.341 26.965 11.21 C 26.335 11.545 23.197 13.924 22.45 14.47 C 20.941 13.448 19.381 12.27 17.901 11.193 C 18.006 10.669 18.713 8.998 18.925 8.369 C 19.829 5.694 21.248 2.668 22.023 0 L 22.788 0 Z" fill="rgb(28, 26, 26)" height="44.486082377664px" id="u84SiQ2Nx" transform="translate(0 0.255)" width="44.80873390361835px"/></svg>)